
If you've never built a profit and loss forecast before, the hardest part isn't the math. It's knowing where to begin, what to put in, and whether your numbers make sense. Phrases like "forecasted profit and loss statement" sound technical and intimidating. They shouldn't be.
A P&L forecast uses basic calculations and details you already know as a business owner. What most beginners actually need is a clear, step-by-step method to pull it all together.
That's exactly what this guide is for. It walks through every step, every piece, and shows you how to present your forecast in a professional way, whether you're handing it to a lender, pitching an investor, building a business plan or attaching it to an SBA loan application.
You'll also learn how to build one from scratch, even if your business has no sales history yet.
What is a profit and loss forecast?
A profit and loss forecast is an estimate of your business's revenue, costs, and net profit across a future time period, usually 12 months. It's designed to answer one simple question: Is your business going to make money?
It isn't a promise. It's an organized, numbers-based prediction built from what you know about your expenses, your prices, and the sales you can reasonably expect. The discipline of building one forces you to get specific about assumptions you'd otherwise leave vague.
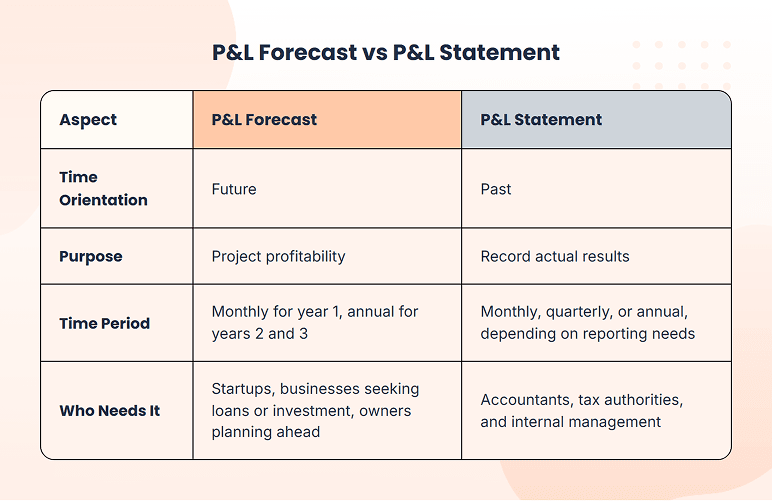
How is it any different from your P&L statement?
Many beginners mix it up with a P&L statement. The two look nearly the same but do opposite jobs. A P&L statement captures what actually took place during a period that's already finished. A P&L forecast projects those same numbers ahead for a period that hasn't arrived yet. One is a record; the other is a plan.
What goes into a P&L forecast?
Every P&L forecast is built from the same six components, regardless of your industry or business size.
- Revenue: all money coming in from selling your product or service
- Cost of Goods Sold (COGS): direct costs tied to producing what you sell
- Gross Profit: revenue minus COGS
- Operating Expenses: fixed and variable costs of running the business
- Non-Operating Items: interest on loans, depreciation, or income outside core operations
- Net Profit (or Loss): what's left after everything is subtracted
Always keep COGS and operating expenses in separate line items. Investors want to see your gross profit margin and net profit margin independently. They tell very different stories about your business.
How to create a profit and loss forecast in 5 steps?
Most people get stuck here not because the process is hard, but because they're not sure if their numbers are realistic. Go through each step in order, and you'll have a complete P&L forecast by the end.
Step 1 — Start with your revenue forecast
Revenue is the starting point for everything else in your forecast. If this number is wrong, everything after it will be wrong too.
If your business is already running, use your past sales data from the last 12 to 18 months. Find your average monthly growth rate and use it to project forward.
For example, if you made $8,000 last month and $8,400 this month, that’s 5% growth. At that rate, you could reach about $14,000 by month 12.
Just remember to adjust for seasonality. If December is usually slow, don’t assume it will grow at the same rate as stronger months like October.
If you are starting from zero, use the bottom-up method. Begin with what you can realistically sell in month 1. Think about:
- How many units or clients can you actually get?
- At what price?
Then build your numbers month by month.
Don’t say things like “we’ll get 5% of a $10 million market.” Instead, be specific. For example, “we can close 8 clients at $500 each in month 1.” This is much more realistic and easier to defend.
One rule for both cases: always build your forecast monthly for at least 12 months. A single yearly number can hide slow months where cash becomes tight. Monthly breakdowns show these gaps clearly.
If you are unsure, reduce your revenue estimate by about 20% before finalizing. Most new businesses earn less than expected in year one, so this keeps your forecast more realistic and reliable.
Step 2 — Estimate your cost of goods sold (COGS)
COGS is simply what it costs you to make or deliver the thing you sell. Run a bakery? It's your flour, sugar, and boxes. Sell clothes? It's the fabric and the stitching. Run a SaaS app? It's your server bills and payment fees.
The easiest way to think about it is as a percent of your sales. Let's say your COGS is 30% and you plan to generate $15,000 revenue next month. That means $4,500 goes to COGS. This percentage is a reasonable starting point, but revisit it every quarter — supplier pricing, product mix, and scale effects will all move it over time.
If you provide a service, like coaching or consulting, your COGS is most likely zero or near it. Your high costs are your time and your team, and those sit under operating expenses, not here.
But if you hire contractors, pay per-job platform fees, or have software costs tied to specific clients, those go in COGS. Leaving them out makes your margins look better than they are, and lenders will notice.
What if you don’t have past data to calculate COGS?
If you do not have historical numbers, use average industry benchmarks as a starting point. For example:
- Retail: 40% to 60%
- Restaurants: 25% to 35%
- SaaS: 20% to 30%
These are not exact numbers, but they give you a realistic baseline to build your forecast.
Step 3 — Project your operating expenses
Operating expenses are everything it costs to run your business day to day, outside of what you spend producing your product. They split into two types: fixed expenses and variable expenses.
Fixed expenses stay the same every month, no matter how much you sell. For each one, just enter the actual dollar amount:
- Rent or lease
- Salaries and wages
- Utilities
- Insurance
- Software subscriptions
- Professional services like your accountant or lawyer
- Loan repayments
Variable expenses are different. They go up or down depending on how much you sell, so the easiest way to forecast them is as a percentage of revenue:
| Expense Category | Typical Range / Basis |
|---|---|
| Marketing and advertising | 5-10% of revenue |
| Payment processing fees | 2-3% of revenue |
| Shipping and packaging | Varies by volume and carrier |
Add both together, and you have your total operating expenses for the month.
How do I make sure I'm not missing any expenses?
Start with your checklist and go through it one item at a time. If it applies to your business, include it.
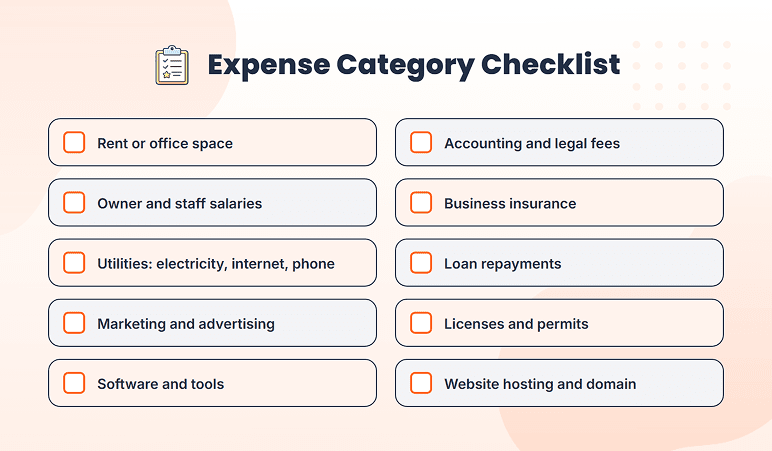
First-timers commonly forget these specific costs:
- Annual fees like insurance or software (divide by 12 to make them monthly)
- One-time startup costs like equipment deposits or branding
- Bank fees and payment processing charges
If you haven’t launched yet, try to get real quotes for your biggest expenses, like rent, insurance, and equipment. This makes your numbers much more reliable.
Once your list is complete, add a 10-15% buffer on top. There will always be unexpected costs, especially in your first year.
Step 4 — Add non-operating items
Non-operating items are any money coming in or going out that isn't directly tied to selling your product or service. They sit outside your core business activity, but they still affect your bottom line.
| Non-operating income examples | Non-operating expense examples |
|---|---|
| Interest earned on your business savings account | Interest payments on a business loan |
| Income from subleasing part of your office space | Depreciation on equipment you've purchased |
| Grants or one-time payments received | Loss on sale of an asset |
For most small businesses, these numbers are small. But leaving them out makes your forecast incomplete.
What if I don't have any non-operating items?
That's completely fine, especially if you're pre-launch. Enter zero for now and move on. As your business grows and you take on loans or purchase equipment, you'll add these in.
Step 5 — Calculate your net profit and check your numbers
Once you have all four numbers, use this formula:
Net Profit = Revenue − COGS − Operating Expenses ± Non-Operating Items
Let's use a real example. A coffee shop brings in $15,000 a month. They spend $4,500 on COGS, $7,000 on operating expenses, and pay $500 in loan interest. That leaves $3,000 in net profit. Simple as that.
How do I know if my forecast is realistic?
The easiest way is to compare your numbers against what similar businesses look like. Three things to check:
First, your COGS ratio. If it looks significantly different from the industry benchmarks we covered in Step 2, go back and check your assumptions.
Next, your net profit margin. Restaurants usually land around 2 to 6%. Software runs 15 to 25%. Retail sits at 2 to 6%. If your margin looks unusually high, your expenses are probably underestimated.
Finally, your revenue. Does it match what a similar business would realistically make in year one? You can check industry averages through SBA, SCORE, or NYU Stern's margin database.
Build your forecast in monthly columns, not just an annual total. A business can look profitable for the full year but run out of cash in March, for example. Monthly columns show those gaps before they happen.
How to build a P&L forecast when you're starting from zero?
If your business hasn't launched yet, you won't have a sales history to work from. That's fine. The approach is just different.
As we covered in Step 1, start with what you know. What will you charge? How many clients or units can you realistically get in month 1? Build your revenue from the ground up, not from market share guesses.
For costs, don't estimate from memory. Get real quotes for your biggest expenses:
- Rent or office space
- Business insurance
- Equipment or tools you need to launch
- Supplier or inventory costs
Real numbers make your forecast credible. Guesses don't. And once you have your numbers, add a 10 to 15% buffer on expenses. First-year costs almost always run higher than expected.
Once your numbers are in, compare them against industry benchmarks as explained in Step 5.
If everything looks reasonable, you have a working forecast, even without a single day of sales history behind you.
Building a forecast from scratch takes more research than updating an existing one, but the process is the same. And if you want to skip the spreadsheet altogether, Bizplanr's financial forecasting tool walks through this process automatically, even for pre-revenue businesses.
Investors know your projections won't be perfectly accurate. What they're looking for is whether your assumptions are logical. Document your financial assumptions in a notes column alongside your forecast. It shows you've done the work.
Why do you need three forecast scenarios, not just one?
A single forecast is a guess. Three scenarios give you a real plan.
Most first-time founders build one version and treat it as fact. But revenue rarely comes in exactly as projected. Clients cancel, a big contract lands early, or the first few months are slower than expected. Building three scenarios prepares you for all of it.
1) Base case: Your most realistic projection. Conservative but achievable. This is the version you present to lenders and investors.
2) Upside case: Everything goes better than expected. A big contract lands, or a marketing campaign outperforms. Take your base case revenue and increase it by 20 to 30%.
3) Downside case: The first months are slow, or a key client drops. Take your base case revenue and reduce it by 20 to 30%. Keep expenses the same or slightly higher.
Building all three takes less time than you think. Start with your base case, make two copies, and adjust the revenue line up or down. That's it.
Investors expect scenarios because it shows you've thought about risk. Your downside case tells you how long your runway is. Your upside case tells you when you can afford to hire or expand.
5 Common P&L forecasting mistakes (and how to avoid them)
The math in a P&L forecast is simple. What trips people up is the assumptions behind the numbers. These five mistakes show up in almost every first attempt.
1. Overestimating year-one revenue
Founders project what they hope to make rather than what they can realistically close. As covered in Step 1, build your revenue from the bottom up, not from a market size percentage down.
2. Forgetting one-time startup costs
Security deposits, equipment, legal fees, and branding all cost money before your first sale. As covered in Step 3, list every launch cost separately and include them in months 1 through 3. Skip these, and your early months will look far more profitable than they actually are.
3. Ignoring seasonality
A single annual number hides what's happening month to month. A gift shop that does 50% of its sales in November and December will struggle in April. Always adjust each month individually, not just the annual total.
4. Not updating after the first month
Once your business is running, compare your actual numbers against your forecast every month. If revenue keeps coming in 15% below projection, adjust your growth rate. If a cost category keeps running over, update that number. A forecast you never revisit stops being useful very quickly.
5. Confusing profit with cash
Your P&L forecast can show a healthy net profit while your bank account is empty. That's the cash flow vs profit problem. Profit tells you if your business model works. Cash tells you if you can pay your bills this month. They're two different numbers, and you need to track both.
Conclusion
A P&L forecast isn't a guarantee. It's a structured way to think through your business's financial future before you're too deep in to course-correct. The discipline of building one forces you to get specific about your revenue assumptions, your cost structure, and how long it realistically takes to turn a profit.
You don't need perfect numbers to get started. A forecast built on honest, well-researched assumptions is far more useful than operating without one, whether you're pitching an investor, applying for a loan, or just trying to plan ahead.
If you're ready to build yours, Bizplanr's financial model generator walks you through the entire process without a spreadsheet. And if you want to understand how your P&L forecast fits into the bigger picture, our financial projections guide covers everything you need to know.
Get Your Business Plan Ready In Minutes
Answer a few questions, and AI will generate a detailed business plan.
Frequently Asked Questions
How far ahead should a profit and loss forecast go?
Most people start with 12 months. That is usually enough to get clarity. If you are preparing a business plan, though, lenders and investors will expect more.
Show year 1 month by month, then year 2 and year 3 as yearly totals. For regular use, a lot of businesses just keep updating a 12-month forecast every month instead of rebuilding it from scratch.
Can I create a P&L forecast without an accountant?
Yes, and many business owners do. You really just need a clear picture of your revenue sources, direct costs, and regular operating expenses. A simple spreadsheet or a tool like Bizplanr's financial model generator will handle the math for you.
That said, if you are preparing projections for investors or lenders, having a CPA (certified public accountant) look over your numbers before you present them is a smart move.
What is a good net profit margin for a small business?
Honestly, it comes down to your industry. Retail typically runs between 2% and 6%. Service businesses usually land somewhere in the 10% to 20% range. SaaS and software can go anywhere from 15% to 25%. Restaurants tend to fall around 2% to 6%.
Look up benchmarks for your specific industry through the SBA or SCORE rather than guessing at a target.
What's the difference between a profit forecast and a revenue forecast?
A revenue forecast only tells you how much money you expect to bring in from sales. A profit and loss forecast takes things further by factoring in your costs, both the cost of goods sold and operating expenses, to show what you actually keep.
Revenue is the top line; net profit is the bottom line. You need both to get a realistic picture of whether your business model actually works.


Follow Kaylee Philbrick-Theuerkauf