
Most first-time founders don't struggle with the idea of a sales forecast. They struggle with where to actually begin.
You sit down, open a spreadsheet, and suddenly realize you have no idea what numbers to put in or how to justify them.
I get it. You're not a finance person. You may not have a single customer yet. But every investor, lender, and SBA loan officer will ask for revenue projections before they take you seriously.
Here's what I want you to know: Building a credible sales forecast is simpler than it looks when you have the right method.
In this guide, I'll walk you through how to build one from scratch, even if you have no sales history.
What is a sales forecast?
A sales forecast is your best-educated guess at how much money your business will bring in, and when.
Think of it as a simple table where you list what you sell, how many units you expect to move each month, your price per unit, and the revenue that adds up to.
But it's not just a document you build for investors. Your forecast also drives operational decisions: How much inventory to order, when to hire, and whether you have enough cash to cover a slow month.
Within your business plan, it lives inside the financial projections section, and it's usually the first table an investor turns to. Because before anything else, they want to know: How much money will this business make?
Here's what even a basic sales forecast looks like in practice:
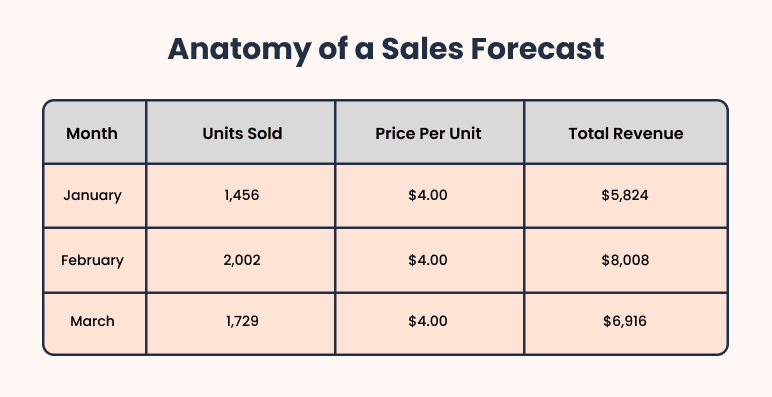
Each product or service your business sells gets its own row. The table above shows a single product line.
It's also worth knowing how a sales forecast is different from a financial projection, as people often mix them up:
A financial projection is broader: It covers revenue, expenses, profit and loss, cash flow, and your balance sheet. Your sales forecast feeds into all of it. I think of it as the starting point for your entire financial plan.
Project monthly for the first 12 months, then quarterly or annually for years 2-3. Investors care most about year 1. Make those numbers detailed and defensible.
3 sales forecasting methods that work for small businesses
There are dozens of forecasting methods out there. Most of them are built for large companies with finance teams and years of sales history. If you're a first-time founder, you only need to know three.
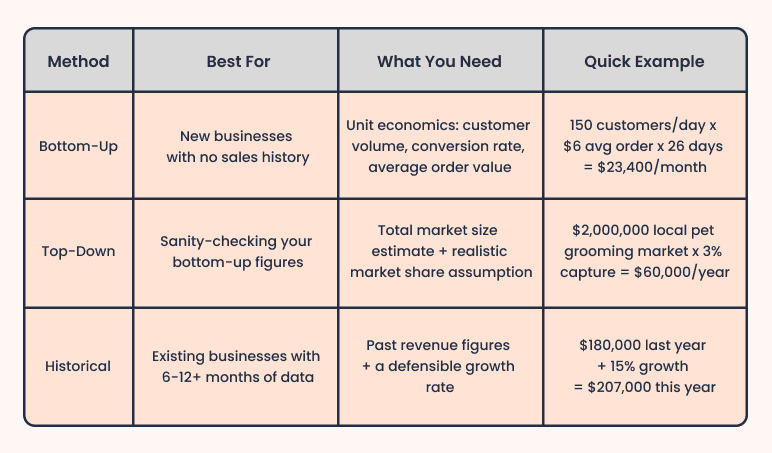
1) Bottom-up forecasting
This is the method I recommend for most new businesses, and it's simpler than it sounds.
You start with the smallest unit of your business, like a single customer or a single sale, and build up from there.
Here's a quick example. Say you're opening a coffee shop in Austin, Texas. You expect 150 customers a day, each spending around $6 on average, and you're open 26 days a month. Multiply that out, and you get $23,400 in monthly revenue.
That's it. No guessing. Just real numbers based on real assumptions. And when an investor asks, "How did you come up with this?", you have a clear, specific answer ready.
2) Top-down forecasting
This one works the other way around. Instead of starting small, you start with the big picture and work your way down.
Let's say the pet grooming market in your city is worth $2,000,000 a year. You think you can realistically capture 3% of that. So your year 1 forecast is $60,000.
Sounds simple, right? It is. But here's where a lot of first-time founders get tripped up.
3% sounds like a tiny slice. But $60,000 at an average spend of $100 per customer means you need 600 paying customers choosing you over every other groomer in town that's already been around for years. That's harder than it looks on paper.
My advice: Don't rely on top-down alone. Use it as a sanity check alongside your bottom-up numbers. If they're roughly in the same ballpark, you're in good shape. If they're way off, one of your assumptions needs a closer look.
3) Historical forecasting
Historical forecasting uses your past sales as a baseline and applies a growth rate to project forward. If your business brought in $180,000 last year and you have reason to expect 15% growth this year, your forecast is $207,000.
This method only works if you have data. If you haven't made your first sale yet, this method isn't for you right now.
Come back to it once you have at least 12 months of revenue to work from. Anything less and you'll miss critical seasonal patterns: Your Valentine's Day spike, your summer slowdown, your holiday peak.
A forecast built on 6 months of data will structurally underestimate how much your revenue actually swings between your best and worst months.
Here’s a quick comparison of all 3 methods:
The best approach is to use both bottom-up and top-down as a cross-check.
Build bottom-up first to get a specific number, then verify it against your top-down market share estimate. If the two figures are far apart, revisit your assumptions before moving forward.
How to make a sales forecast in 5 steps?
Here is the exact process to build a sales forecast you can drop straight into your business plan. I'll use a bakery example throughout to keep the math concrete, but the steps work for any business type.
Step 1: List your products or services and set prices
Start by writing out every product or service your business sells with a price next to each item. If you're a bakery, that looks like this:
- Drip coffee ($4)
- Pastries ($5)
- Custom cakes ($45)
- Catering packages ($800)
Each product line gets its own row in your forecast table. Use your business plan's products and services section as a starting point since you've likely already listed everything there. But…
What if I haven't finalized my pricing yet?
Use your best guess based on what similar businesses in your area charge. Look at a few competitors, pick a number that feels realistic, and go with it.
A forecast built on approximate prices is far more useful than no forecast at all. You can always update it as you get closer to launch.
If you offer different pricing tiers, like a basic plan at $29 and a premium plan at $79, give each tier its own row in your forecast. Don't average them into one number.
Keeping them separate lets you see exactly how your revenue shifts as more customers move up to the higher tier over time.
Should I include free trials or freemium users?
Only paying customers go into your forecast. Free users don't generate revenue, so they don't belong in your sales numbers.
If you expect some free users to convert to paid, forecast only those conversions. Here's how:
- Take your expected free user count
- Apply a realistic conversion rate
That's your paying customer estimate. So if you expect 500 free users in month one and 5% typically convert to paid, forecast 25 paying customers from that group. That's a number you can actually defend to an investor.
What if I plan to raise prices later in the year?
Apply the new price starting from the month it goes into effect. Don't spread it across the whole year or average it out.
If you're charging $4 for coffee from January through June and bumping it to $5 in July, your forecast should show $4 for months one through six and $5 from July onward. This keeps your numbers clean, accurate, and easy to explain.
Step 2: Estimate your unit sales (monthly)
For each product line, figure out how many units you expect to sell each month.
Start with what you already know: How many people walk into your store, visit your website, or reach out to book an appointment. Then think about how many of those people actually end up buying.
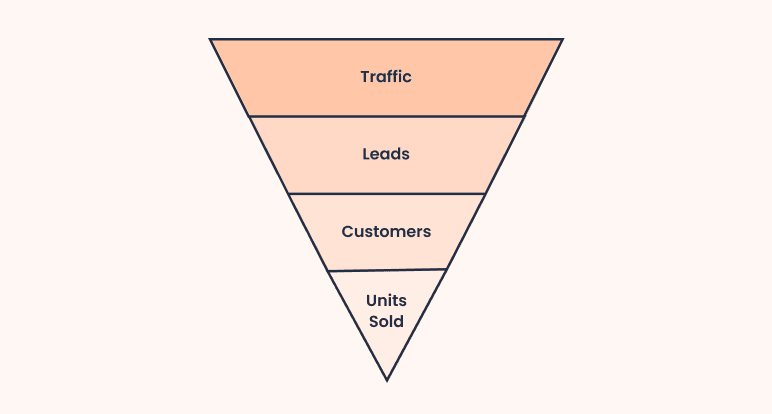
Here's a simple example. Say 1,000 people visit your website in a month. Out of those, maybe 200 click around, 50 send an inquiry, and 20 actually buy something.
That's a 2% conversion rate, and those 20 people are your estimated unit sales for the month. Simple as that.
The conversion rate is the number most founders struggle with because they have nothing to base it on yet. If that's you, a 1-2% rate on cold traffic is a credible and defensible starting point for most new businesses.
As you get real data from your first few months, you'll refine it. But starting conservative is always better than starting optimistic, especially when an investor is reviewing your assumptions.
How do I estimate units for a service business where I sell hours, not products?
For a service business, just swap "units" for whatever you actually deliver.
A consultant billing 80 hours a month at $100 per hour is doing the exact same math as a bakery selling 80 pastries. An hour of work, a session, a finished project, and that's your unit.
When your business has very few but very high-value sales, use the same approach. A contractor closing 2-3 projects a month at $5,000 each works exactly the same way.
Just list each project type as its own line and estimate how many you can realistically land per month.
What's a reasonable ramp-up curve for month 1?
Most new businesses start at around 25-30% of what they expect to handle at full capacity. Then grow from there.
So if you expect 100 customers a day eventually, plan for 25-30 in month one and build up gradually. Don't assume full capacity on day one.
Investors are more likely to be impressed by a forecast that shows steady, explainable growth than one that starts at the top and stays there.
A realistic ramp tells them you understand how businesses actually grow.
Step 3: Calculate monthly revenue
Once you have your unit sales estimated, you're ready to calculate your monthly revenue.
For each product line, multiply the number of units you expect to sell by your price per unit. Then add all your product lines together to get your total monthly revenue.
Revenue = Units Sold x Price Per Unit
If you're a service business, the same formula applies. Your "units" are just hours, sessions, or projects, and your "price per unit" is your hourly rate, session fee, or project rate.
A consultant billing 80 hours at $100 per hour has a monthly revenue of $8,000. Same math, different numbers.
Run that calculation for every product or service line and sum them for your monthly total. Build this across all 12 months.
Your sales forecast shows revenue before taxes. So leave those out here. Taxes are handled separately further down your financial statements.
Do I need to consider discounts or promotions?
When you offer a launch discount in month 1, apply the discounted price for that month instead of your full price. So if your product normally sells for $50 but you're launching at $35, use $35 in your month 1 calculations.
And for refunds or returns? A 2-5% reduction in your gross revenue is standard for most industries.
You don't need to nail this number in your first draft. But including it shows investors you've thought beyond just the best-case scenario.
How do I handle recurring revenue like subscriptions vs. one-time sales?
Treat them as separate product lines. For one-time sales, you start fresh each month and estimate new buyers.
For subscriptions or retainers, don't reset to zero. A customer who signed up in January is still paying in February, March, and June. Carry those customers forward every month and only add new subscribers on top.
That way, your recurring revenue builds steadily over time instead of disappearing and restarting each month.
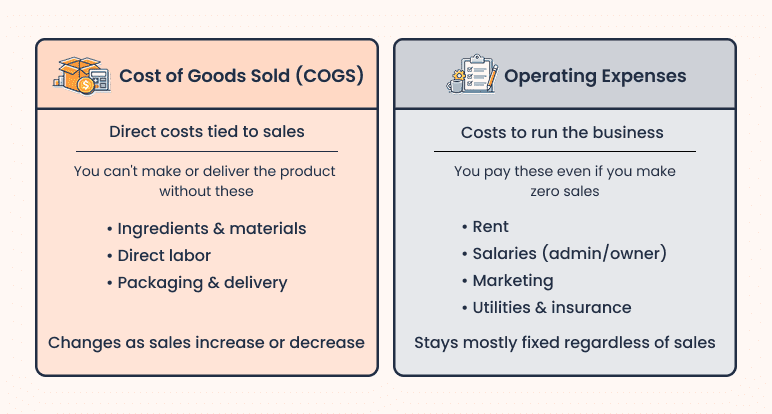
Step 4: Subtract your COGS (cost of goods sold)
COGS are the direct costs that go into making or delivering what you sell. For a bakery, that's ingredients, packaging, and the staff actually making the products.
Once you have your monthly revenue, subtract your COGS to get your gross profit.
Gross Profit = Revenue - COGS
This number tells you whether your pricing actually works before you factor in rent, salaries, and everything else.
What counts as COGS vs. an operating expense?
Think of it this way. If the cost disappears when you stop selling, it's probably COGS. If it stays regardless of how much you sell, it's an operating expense.
So for a bakery, flour and packaging are COGS. Rent, marketing, and utilities are operating expenses and belong further down your income statement, not here.
And labor cost is the one that trips most people up. Direct production labor, the staff actually making or delivering your product or service, counts as COGS. Your own salary and administrative staff belong in operating expenses.
What if I'm a service business with almost no COGS?
If you're a service business with minimal physical materials, your COGS may be close to zero. That's completely normal.
Some consultants and coaches run COGS under 5% of revenue. Don't leave the line blank, though. A short note explaining your COGS assumptions is better than silence.
If you haven't locked supplier prices yet, that’s totally fine. Use industry benchmarks as your starting point. Here's a rough estimate by business type:
- 28-35% of revenue for food and beverage
- 30-50% of revenue for retail merchandise
- 25-45% of revenue for e-commerce
- 0-10% of revenue for consulting or professional services
Update them as you get real supplier quotes, and your actual costs become clearer.
Step 5: Adjust for seasonality and growth
Once you have your baseline 12-month table, two quick adjustments make it way more realistic: Seasonality and growth.
Most first-time founders skip both and end up with a forecast that goes up in a straight line every single month. That's not how real businesses work.
If you don't have your own sales history yet, look at industry patterns on Google Trends or the U.S. Census Bureau's retail sales data. For instance:
- A bakery will see a Valentine's Day spike in February and a summer lull in July.
- A tax preparation service peaks between January and April, then goes quiet.
Adding those patterns into your forecast tells investors you really understand your market. Not just your product.
What if my business isn't seasonal at all, like a B2B SaaS?
That's totally fine. Skip the seasonality adjustment and focus entirely on your growth rate instead.
Map out what's going to drive revenue jumps each month: A product launch, a new pricing tier, a big partnership, and build those into the right months.
For growth rate, somewhere between 5-10% month-over-month is a reasonable starting point for most new small businesses. But don't just copy-paste the same percentage across all 12 months.
Think about what's actually happening in your business and let that drive the numbers.
Should I factor in a marketing campaign I'm planning to run in month 3?
Build it directly into your forecast as a separate bump for that month. Don't average it across the year or leave it out because you're not sure how it will perform.
Estimate what the campaign will actually deliver based on your budget, your channel, and a realistic conversion rate. Then add those extra customers to your month 3 unit sales.
Keep the assumption visible, either in a note next to the number or in your assumptions table. A specific, math-backed bump is completely credible to an investor. A random spike with no explanation is not.
Build 3 versions of your forecast: conservative, moderate, and aggressive. For conservative, apply 25% lower customer volume than your base case. For aggressive, apply 25% higher. Keep pricing & COGS constant and only vary the demand side. That's it.
How to forecast sales when you have no history?
Not every founder has months of sales data to work from. If you're just starting out, that's completely normal. Here are four ways to build credible estimates from scratch, even before you make your first sale.
1. Research what comparable businesses earn
Your competitors won't share their revenue, but the data often exists somewhere public.
Look for businesses similar to yours in a similar city or market and use their numbers as a starting anchor. If a coffee shop in a comparable city generates $400,000 a year, that's a meaningful reference point for your own projections.
2. Use industry benchmarks from reliable sources
You don't have to guess blindly. Several free sources publish average revenue figures by business type and region:
| Source | What it gives you |
|---|---|
| SBA | Financial benchmarks for common small business categories |
| SCORE | Industry benchmarks + free Financial Projections Template |
| U.S. Census Bureau's Annual Business Survey | Average revenue by business type and location |
| IBISWorld | Detailed industry revenue averages by sector |
If a franchise exists in your industry, Franchise Disclosure Documents (FDDs) are legally required to publish their average location revenue.
Search the brand name plus "FDD" to find it. It's publicly available and useful as benchmarks, even if you're not buying a franchise.
These sources won't tell you exactly what you'll earn, but they give you a realistic range and a credible source to reference when an investor asks how you arrived at your numbers.
3. Run a pre-launch test
If you have the time, this is honestly the best thing you can do. A waitlist, a pre-order, or even a small pilot sale gives you real numbers before you officially open.
Say 200 people sign up for your waitlist, and 40 of them become paying customers. That's a 20% conversion rate you can plug straight into your forecast.
Even a weekend pop-up or a soft launch to friends and family counts. Any real transaction data is worth more than the best industry benchmark out there.
4. Build from the ground up
If none of the above is an option yet, that's okay. Go back to the bottom-up method we covered earlier.
Start with your expected foot traffic or website visitors, apply a realistic conversion rate, and multiply by your average order value.
Keep it conservative. A 1-2% conversion rate on cold traffic is way more believable to an investor than 10%. And starting low gives you room to show growth rather than having to explain why you fell short.
In short, try a pre-launch test first if you have time. If not, use industry benchmarks and validate with a bottom-up build.
Your local SBA district office often has industry-specific revenue benchmarks for startups that aren't published online. It's free data, and citing it makes your forecast significantly more credible with lenders.
Sales forecast example (with real numbers)
Let's put everything we just covered into practice with a real example.
Take an Austin bakery that sells four products. Drip coffee ($4). Pastries ($5). Custom cakes ($45). Catering packages ($800).
It's a brand new business. No sales history, no existing customer base. Just a founder who's done their research, knows their market, and is ready to put some numbers on paper. Sound familiar?
Good. We're going to build out its complete 12-month forecast step by step using the exact process we just covered.
But before we get to the numbers, here are the assumptions for the forecast:
| Assumption | Detail |
|---|---|
| Daily customers (January) | 80, ramping to 130 by December |
| Purchase rate: coffee | 70% of customers per visit |
| Purchase rate: pastries | 50% of customers per visit |
| Custom cake orders | 10 per month in January, growing to 20 by December |
| Catering packages | 1 in January, reaching 4 by December |
| Operating days | 26 days per month |
| February seasonal spike | 110 daily customers, cake orders jump to 18 |
| July seasonal dip | 90 daily customers, Austin's summer slowdown |
| COGS benchmark | 31% of revenue, food service standard |
None of these numbers was pulled from thin air.
- Daily customer estimates came from foot traffic research on comparable Austin coffee shops.
- Purchase rates came from industry averages for bakery-café concepts.
- The seasonal patterns reflect what most food businesses in Austin actually experience.
That's the point of the bottom-up method: Every assumption has a source, and every source can be defended.
Here's how the full year plays out:
| Month | Coffee | Pastries | Custom Cakes | Catering | Total Revenue | COGS | Gross Profit |
|---|---|---|---|---|---|---|---|
| Jan | $5,824 | $5,200 | $450 | $800 | $12,274 | $3,805 | $8,469 |
| Feb | $8,008 | $7,150 | $810 | $1,600 | $17,568 | $5,446 | $12,122 |
| Mar | $6,916 | $6,175 | $540 | $800 | $14,431 | $4,474 | $9,957 |
| Apr | $7,280 | $6,500 | $585 | $1,600 | $15,965 | $4,949 | $11,016 |
| May | $7,644 | $6,825 | $630 | $1,600 | $16,699 | $5,177 | $11,522 |
| Jun | $8,008 | $7,150 | $630 | $2,400 | $18,188 | $5,638 | $12,550 |
| Jul | $6,552 | $5,850 | $495 | $1,600 | $14,497 | $4,494 | $10,003 |
| Aug | $7,280 | $6,500 | $585 | $1,600 | $15,965 | $4,949 | $11,016 |
| Sep | $8,008 | $7,150 | $630 | $2,400 | $18,188 | $5,638 | $12,550 |
| Oct | $8,372 | $7,475 | $675 | $2,400 | $18,922 | $5,866 | $13,056 |
| Nov | $8,736 | $7,800 | $720 | $2,400 | $19,656 | $6,093 | $13,563 |
| Dec | $9,464 | $8,450 | $900 | $3,200 | $22,014 | $6,824 | $15,190 |
| Total | $92,092 | $82,225 | $7,650 | $22,400 | $204,367 | $63,353 | $141,014 |
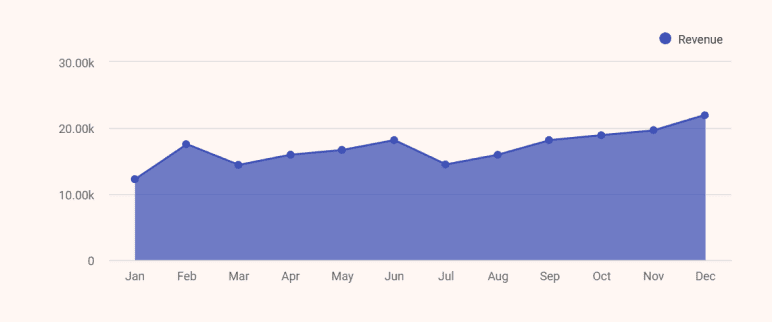
A few things worth noticing in the numbers. Revenue dips in March after the Valentine's Day spike, which is totally normal. It softens again in July, then picks back up through the holiday season.
That kind of shape is way more believable than a straight line going up every single month. Real businesses have slow months and busy months, and that forecast tells a lender you actually get how your business works.
Remember, a projection that lands on $204,367 looks like someone really did the math. Whereas the one that lands on $200,000 sounds like a guess.
What if your sales forecast turns out to be wrong?
Most first-time founders worry about this more than anything else.
The short answer is: It's okay if it's wrong. What matters is what you do next.
When your actual numbers don't match your forecast, don't ignore it. Sit down and figure out which assumption was off:
- Did fewer customers show up than expected?
- Was your conversion rate lower than you projected?
- Did a slow month hit earlier than anticipated?
Pinpoint the exact assumption that you missed and adjust it going forward. Then update your forecast for the remaining months based on what you now know.
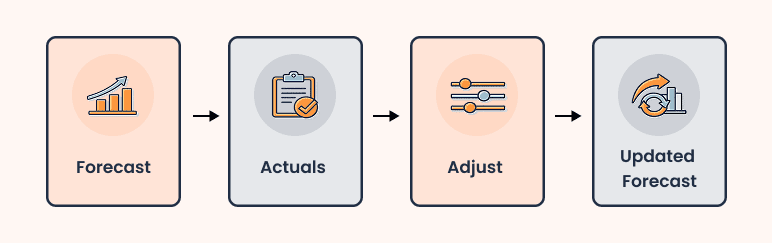
A founder who says, "We projected 150 customers in month one and got 90, so we've adjusted our conversion rate going forward," is far more credible to an investor than one who has no explanation for the gap.
Update your numbers every month in year one. That's it. Your forecast is only useful if you keep it current.
How to present your sales forecast in your business plan?
Building the forecast is only half the job. How you present it matters just as much. A well-built forecast that's poorly laid out will still lose credibility with an investor.
Place your forecast in the financial projections section of your business plan, after your market analysis and marketing strategy.
That order makes sense because by the time a reader gets to your numbers, they already know who your customers are and how you plan to reach them. The forecast feels like a natural next step, not a random spreadsheet.
Before showing the table, write 2-3 sentences explaining how you got to your numbers. Don't just drop a spreadsheet and expect the reader to figure it out. Add something like:
- What's your expected customer volume?
- Did you build in any seasonal patterns?
That short explanation tells the reader your starting volume, your growth trajectory, and your seasonal logic all at once. Without it, even a solid forecast can feel like a guess.
Why do visuals and charts make your forecast easier to understand?
Most people don't read tables line by line. They scan.
A simple bar or line chart next to your table shows your growth curve, seasonal dips, and overall trajectory at a glance.
An investor can see the shape of your business in seconds without reading a single row. Use the table for the details and the chart for the bigger picture. Together, they tell a much clearer story than either one alone.
Finally, make sure your numbers match across every section of your plan. If your forecast shows $204,367 in year 1, that same figure needs to appear in your income statement, cash flow, and executive summary. A single mismatch is enough to raise a red flag.
Build your sales forecast with Bizplanr
You now have everything you need to build a sales forecast that actually holds up. A clear method, realistic assumptions, and a 12-month table that reflects how your business works in the real world.
The hardest part isn't the math. It's keeping everything consistent as your numbers evolve.
Change one assumption in a spreadsheet, and suddenly figures are off across multiple sections of your plan. That's where Bizplanr helps.
Use our AI financial forecasting tool that builds your forecast based on your business type and assumptions, and it plugs directly into your business plan. No formatting headaches, no numbers falling out of sync.
You've done the thinking. Now put the numbers together and create your business plan.
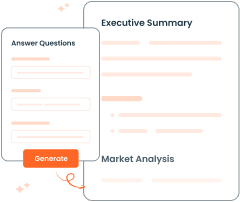
Get Your Business Plan Ready In Minutes
Answer a few questions, and AI will generate a detailed business plan.
Frequently Asked Questions
What is the simplest formula for a sales forecast?
It's pretty simple:
Revenue = Units Sold x Price Per Unit
Estimate how many units you expect to sell each month, multiply by your price, and that's your monthly revenue. Do that for every product line and add them up. That's your forecast.
How far ahead should a sales forecast project?
For most business plans, this is the standard structure:
- Year 1: monthly projections
- Year 2 and 3: annual or quarterly figures
Most SBA lenders expect a 3-year business plan with projections. Some private investors or specific programs for larger loan amounts may ask for 5 years. Check with your lender before submitting so you know exactly what they're looking for.
What is the difference between a sales forecast and a financial projection?
Here's the difference:
- A sales forecast is simply your revenue estimate: how much money you expect to bring in and when.
- A financial projection is everything that comes after it. It takes your sales numbers and adds your expenses, profits, cash flow, and balance sheet on top.
In short, your sales forecast is the starting point, and your financial projections are the full picture. You can't build one without the other.
How often should I update my sales forecast?
Every single month in year 1. No exceptions. Look at what actually came in, and compare it to what you projected. If the numbers don't match, figure out why and adjust your assumptions going forward. After the first year, quarterly updates are usually enough.
What are the common sales forecasting mistakes, and how to avoid them?
Here are a few sales forecasting mistakes that come up constantly:
- Assuming full capacity on day one. Most new businesses start at 25-30% of their expected volume, not 100%
- Ignoring seasonality. A flat line going up every month isn't realistic for most businesses.
- Using round numbers like $200,000 instead of working through the actual math. It makes your forecast look like a guess
- Forgetting to update it after launch. Your forecast is only useful if you keep it current.


Follow Kaylee Philbrick-Theuerkauf