
If you're putting together a business plan, at some point someone is going to ask: "When do you break even?" And you want a real answer ready.
Knowing how to calculate break-even point is actually one of the simplest things in your entire business plan. I'd argue it's the most useful one too. It tells you exactly how many sales you need to cover your costs, the floor your business needs to stand on before it starts making money.
I'll walk you through the formulas, show worked examples for three different business types, and explain how to present them in your business plan.
What does “break-even point” actually mean?
The break-even point is the exact number of sales where your revenue covers all your costs. Every sale after that starts generating profit. Before you reach it, you're operating at a loss.
What makes this number valuable, especially early on, is that it forces you to think about costs and pricing together before you commit to anything.
In a business plan, the break-even point answers the question investors and lenders always ask: when does this business stop losing money? The SBA recommends including it as part of your financial projections for exactly this reason.
Revenue projections show potential. Break-even analysis shows whether the underlying economics actually hold up.
To calculate it, you need three inputs:
- Fixed costs: These are the expenses that stay the same regardless of how much you sell, so they include rent, salaries, insurance, software subscriptions, and loan repayments.
- Variable costs: These include costs that increase with each sale. Raw materials, packaging, shipping, payment processing fees, and per-unit labor all fall under this category.
- Contribution margin: This is what's left from each sale after covering variable costs. This is what chips away at your fixed costs until you break even.
Once your total contribution margin covers all fixed costs, you hit break-even.
The break-even point formula (units and dollars)
There are two ways to calculate your break-even point, and which one you use depends on how your business sells.
Formula 1: Break-even point in units
Break-even point (Units) = Fixed costs ÷ (Selling price per unit – Variable cost per unit)
I find this one the most intuitive. You take your total fixed costs and divide them by the contribution margin per unit, which is simply your selling price minus what it costs to produce or deliver one unit. That result tells you how much each sale contributes toward covering fixed costs.
Formula 2: Break-even point in dollars
Break-even point (Dollars) = Fixed costs ÷ Contribution margin ratio
The contribution margin ratio tells you what share of each dollar in revenue covers fixed costs. If a service sells for $100 and costs $60 to deliver, the contribution margin ratio is 0.40. That means 40 cents of every dollar goes toward fixed costs.
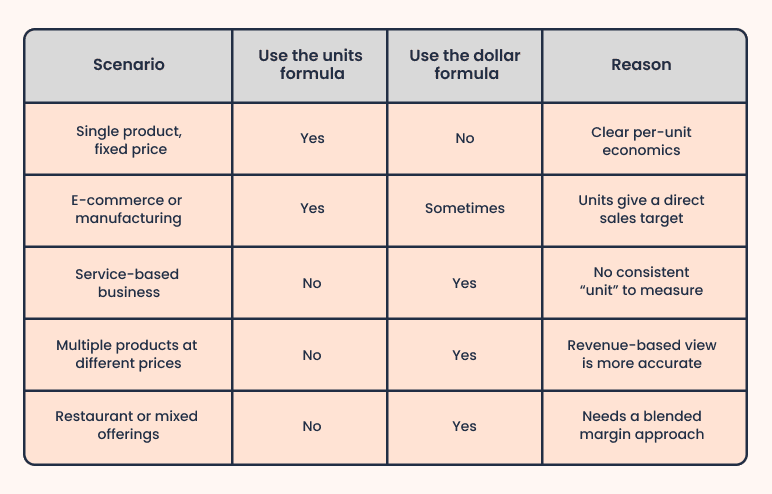
Break-even point in units vs. dollars (When to use each)
Before you calculate your break-even point, pick the right method for your business model.
If you sell one product at a fixed price, use the units formula. It works well for e-commerce, manufacturing, or any business with a single primary offering. If your pricing varies or you sell multiple products and services, the dollar-based formula is more practical. I'd recommend it for restaurants, agencies, and service businesses where there's no consistent unit to measure.
How to find (or calculate) your break-even point (w/ guided examples)
Let me walk you through this with a real business. Say you're opening a small coffee shop. I'll use actual numbers so you can see exactly how each step feeds into the next.
Step 1: List your fixed costs
Start with everything you pay each month before a single cup is sold. I always tell people to be thorough here because underestimating fixed costs is the most common reason a break-even calculation ends up being wrong.
| Fixed Cost | Monthly Amount |
|---|---|
| Rent | $3,500 |
| Salaries (2 staff) | $5,000 |
| Utilities | $600 |
| Insurance | $300 |
| Software/POS | $200 |
| Loan repayment | $900 |
| Total Fixed Costs | $10,500 |
Step 2: Calculate your variable cost per unit
Now work out what it costs to make one cup of coffee. This is where most people get loose with their numbers. Payment processing fees, for example, are easy to forget, but they add up fast at volume.
| Variable component | Cost per Cup |
|---|---|
| Coffee beans | $0.80 |
| Milk | $0.50 |
| Cup and lid | $0.30 |
| Payment processing | $0.20 |
| Labor per cup | $0.70 |
| Total variable cost | $2.50 |
Step 3: Set your selling price
A cup of coffee at this shop sells for $5.00. If you haven't finalized your pricing yet, this step is worth sitting with. Your selling price directly determines how quickly you reach break-even, and I'd recommend running this calculation at two or three different price points before you commit.
Step 4: Calculate your contribution margin
To calculate contribution margin, take your selling price and subtract your variable cost.
Contribution margin = Selling price - Variable cost per unit $5.00 - $2.50 = $2.50 per cup
So, for every cup sold, you are bringing in $2.50 to cover your $10,500 in fixed costs. The bigger this number, the less you have to sell to break even.
Step 5: Apply the formula
Now put it into the formula.
Break-even point (Units) = Fixed Costs ÷ Contribution Margin $10,500 ÷ $2.50 = 4,200 cups per month
That's the number your coffee shop needs to hit every month just to cover its costs.
What does this number actually mean?
The 4,200 cups translates into 140 cups per day over a 30-day month or 18 cups per hour over 8 hours. That's a goal you can stress test.
- What kind of foot traffic do you get?
- What's your seating capacity?
- Can you staff two people to serve 18 cups an hour?
If 140 cups a day feels out of reach, the formula is doing its job. It's a signal to revisit your pricing, costs, or location before you sign on the dotted line.
Real-world break-even examples by business type
All businesses use the same break-even formula, but the business itself tells you how to interpret the answer. It's not useful unless you use it to make decisions.
Retail / E-commerce (T-shirt brand)
Say you run a t-shirt business with $8,200 per month in fixed costs. They sell for $28, and cost $11 to produce and ship. That leaves a $17 contribution margin.
Their break-even volume is ~482 per month.
That may seem possible, but are you positioned to sell 482 units per month?
If your store is selling 200-300 orders per month, then you either need to generate more traffic, convert better, or raise your price. The number forces you to ask: Do I fix marketing, increase price, or reduce costs?
In retail, break-even is more about whether your demand engine can support the required volume.
Service business (Consulting firm)
A consulting firm with $14,500 in fixed monthly costs charges an average project fee of $3,500, with roughly $1,200 in variable costs per project, including contractor fees, software, and client-specific expenses. That leaves a contribution margin of $2,300 and a ratio of 0.66.
Break-even = $14,500 ÷ 0.66 = ~$21,970 per month, or 6 to 7 projects.
What I'd (and you should too) actually want to know is whether the pipeline can support that volume every single month, not just in a strong one.
Consulting deals don't close on schedule. Some months you land four projects, some months two. Break-even in a service business isn't really a pricing check. It's a test of how stable and predictable your sales process actually is.
Restaurant (Mixed products)
A restaurant with $32,000 in fixed monthly costs, an average order value of $22, and variable costs of $13 per order has a contribution margin ratio of 0.41.
Break-even = $32,000 ÷ 0.41 = ~$78,050 per month, or roughly 118 orders a day.
At this scale, it's no longer a matter of money. I'd want to know if the location, tables, and kitchen capacity can handle 118 orders a day (not just on Friday).
If the physical setup caps you at 70 to 80 orders, no pricing adjustment will bridge that gap. The constraint is your capacity, and that's something you need to know before you sign a lease.
| Business Type | How you earn revenue | Formula to use | Break-even output tells you | Key drivers |
|---|---|---|---|---|
| Single product | Fixed price per unit | Units formula | How many units do you need to sell | Traffic, conversion rate, pricing |
| Service-based | Per project / hourly billing | Dollars formula | How much revenue do you need per month | Pipeline strength, deal size, and close rate |
| Multi-product | Mixed pricing across products | Dollars formula (weighted average) | Total revenue required to cover costs | Customer volume, average order value |
When (and how often) to recalculate your break-even point?
Your break-even point is not something you calculate once and file away. Every time your costs, pricing, or product mix change, the number changes with it.
I'd review mine every quarter, but I don't wait if something significant shifts. Here are the changes that should trigger an immediate recalculation:
- Price increase or discount: A change here immediately alters your contribution margin.
- Cost rises and falls: If your rent rises, or labor and material costs increase, your break-even point rises. If costs fall, it falls with them.
- New or changed product/service: A different price point or cost structure shifts your contribution margin and changes your break-even.
- Seasonal changes: If your costs or sales vary month to month, a single annual break-even number won't reflect what's actually happening.
Every time one of these occurs, your break-even point tells you how many units you need to sell to break even. What's important is that the goal you set is still relevant to the business you operate.
How to include break-even analysis in your business plan
Though knowing your break-even point is useful, presenting it clearly in the business plan makes the financials credible to someone reading it for the first time. It belongs in the financial projections section, alongside your income statement, cash flow, assumptions, and funding requirements section. If you're unsure about formatting your business plan, that's a good place to start before plugging in your numbers
I'd structure it in three parts:
- A simple table showing your fixed costs, variable costs, or contribution margin, and the final break-even result
- A break-even chart showing your revenue line crossing total costs
- A short written interpretation explaining what the number means in practice
That last part is what most plans skip, and it's exactly where investors and lenders focus. They want to know three things:
Are your pricing and cost assumptions explicitly stated and defensible? Is the sales volume required to break even realistic, given the market you've described elsewhere in the plan? Does your timeline to break even make sense relative to your funding runway?
That's because investors and lenders want to know whether your business plan assumptions hold up, not just whether the math is correct.
A single break-even number looks clean, but doesn't reflect how businesses actually operate. I'd recommend presenting three:
- Conservative: Higher costs, lower pricing
- Realistic: Expected operating conditions
- Optimistic: Better margins or stronger demand
It shows you've thought through the upside as well as the downside. If you need guidance putting it together, SCORE offers free mentoring from experienced business advisors.
Conclusion
Look at break-even as a quick reality check. If you sell a single product, use the units formula. If your pricing varies or you run a service, use the dollar-based one.
But the number itself isn't important, rather what it tells you: Can you actually hit that sales target? Does your pricing leave enough room? Would this still work if costs go up or demand drops?
In a business plan, this is the part that makes your projections believable. It shows when the business stops losing money and whether your assumptions hold up under pressure.
I'd always run the numbers early, question them, and adjust before I commit to anything. The SBA's interactive BEP calculator is a useful tool to double-check your numbers.
Ready to build your business plan? Build your business plan free with Bizplanr.
Get Your Business Plan Ready In Minutes
Answer a few questions, and AI will generate a detailed business plan.
Frequently Asked Questions
Why is break-even analysis important for a business plan?
Lenders and investors are interested in your break-even point. They want to know when you'll stop losing money, and your break-even point provides them with a time and revenue goal.
How do I know if my break-even point is realistic?
Compare it to your revenue, demand, and capacity. If you can't reach your break-even point without doubling current sales or operating beyond your capacity, then you have a problem with your price, costs, or assumptions.
What happens if I never reach my break-even point?
This typically indicates a change in business model. You either increase prices, decrease costs, or increase demand. If you can't do any of those, the business model is not viable.
Should I lower my price to reach break-even faster?
This often has the opposite effect. It decreases your margin, and you need to sell more to break even. Change the price only if you can grow the demand
How does break-even change if I sell multiple products?
You cannot rely on a single unit price. Instead, use a weighted average contribution margin based on your product mix. If your mix shifts, your break-even point shifts with it.
Is break-even enough to know if my business is profitable?
No. Break-even only tells you when you stop losing money. Profitability depends on what happens after that point, including scaling costs, reinvestment, and margins at higher volume.


Follow Vinay Kevadiya