
At some point while writing your business plan, you'll land on the financial projections section and stop. Not because you don't understand your business, but because you're not sure how to turn what you know into actual numbers that make sense on paper.
That's where financial forecasting models come in. They give your projections a logical structure, something a lender or investor can follow, question, and ultimately trust.
The problem is that there are different models, different methods, and no clear answer on which one fits your business.
In this guide, I'll walk you through 10 financial forecasting models and methods, with real examples and a clear way to choose the right one.
What is financial forecasting (and model)?
Financial forecasting is the process of estimating where your business is headed financially. It's about how your business will earn, spend, and have in the bank over a future period of time.
You're using what you already know, past revenue data, market research, reasonable assumptions, or industry benchmarks (from sources like SBA), to project future income, expenses, and cash flow.
In simple terms, it works as your financial GPS. It won't guarantee anything. But it tells you what's ahead so you can plan around real numbers and make smarter decisions.
A financial forecasting model, on the other hand, is the specific method you can use to build that forecast. It turns your raw data and assumptions into actual numbers.
Different models work in different ways. A brand new business with no sales history needs a different approach than a business that's been running for three years. That's exactly why knowing which model to use matters.
Together, financial forecasting and financial forecasting models cover 3 primary areas:
- Revenue (what you plan to bring in)
- Expense (what you expect to spend)
- Cash flow (whether you'll have enough cash to keep the lights on)
And here's a note that your forecast doesn't need to be perfect. It needs to be defensible. Banks and investors know your numbers are estimates. What they're really evaluating is whether your plan assumptions make sense.
Why bother with a forecasting model when you could just estimate?
Honestly, you can just estimate!
Most founders do exactly that in the early days, and plenty of those businesses work out fine. But the moment you need someone else's money, a lender, an investor, or a business partner, a rough number in your head isn't enough.
Nobody writes a check based on "I think we'll do about $150K next year." They want to see how you got there.
That's really all a forecasting model is. It's your estimate with the logic written out so someone else can follow it, question it, and ultimately trust it.
The second benefit is actually for you. When your numbers are built on a model, you can figure out what went wrong when things don't go as planned.
Revenue came in lower than expected? A model tells you exactly which assumption was off. Were there fewer customers? A lower price point? Slower sales? You can fix it.
If you just estimated, all you know is that the number was wrong. One gives you answers. The other just gives you a shrug.
Think of your forecasting model as the "show your work" part of a math test. The answer matters, but the work is what gets you the grade.
Quantitative vs. qualitative forecasting models
Now, let's move to the two broad families of finance forecasting models every business owner should know.
Here's the simplest way to think about it:
If you've been in business for a while and have sales data to work with. That's quantitative forecasting. Your history becomes your foundation, and you build projections forward from there.
If you're just starting out and have no sales history yet, you're working with research, expert input, and informed assumptions. That's qualitative forecasting. It's not guesswork. It's structured thinking based on what you know about your market.
A quick comparison for better understanding:
| Feature | Quantitative | Qualitative |
|---|---|---|
| Based on | Historical data and numbers | Expert judgment and research |
| Best for | Existing businesses with a track record | Startups or new markets |
| Accuracy | High when data is reliable | Varies based on expertise |
| Examples | Straight-line, moving average, regression | Delphi method, market research |
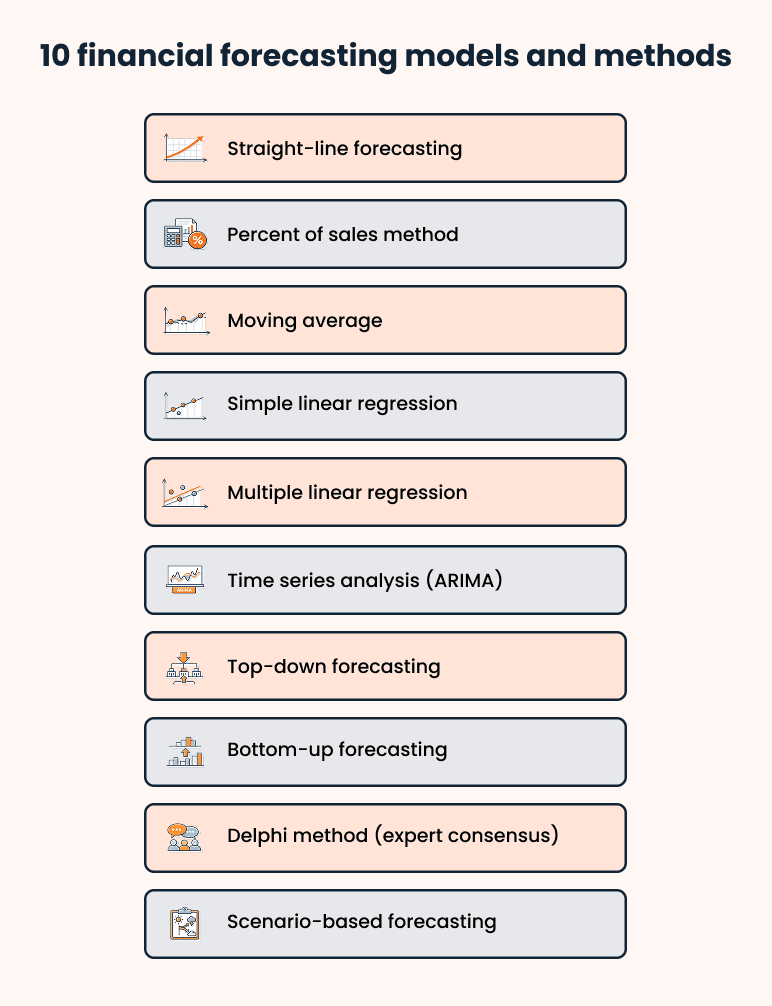
10 financial forecasting models and methods (w/ examples)
Here are 10 financial forecasting methods you'll run into, from the simplest to the most advanced. Honestly, you won't need all of them, but you should know what each one does and when it applies.
1. Straight-line forecasting
The simplest forecasting model out there. You take your current growth rate and project it forward in a straight line.
It works best for businesses with 1-2 years of steady, consistent growth where revenue has been moving at a predictable rate. If your numbers have been relatively stable, this gives you a clean, easy-to-explain starting point.
Example: Your bakery earned $50,000 in Year 1 and grew at 10% annually. Year 2 projection: $55,000. Year 3: $60,500.
Here's to note that a straight-line forecasting is the most dangerous model for an early-stage company to rely on because it rarely reflects how real businesses grow. It doesn't account for seasonality, customer churn, or unexpected costs.
Hence, relying on it alone signals blind optimism to an experienced lender.
2. Percent of sales method
This model works by taking a historical expense ratio and applying it to your projected revenue to estimate future costs.
It's especially useful when you have at least one full year of financials and need to build out your expense projections quickly without overthinking every line item.
Example: Your cost of goods sold has consistently been 30% of revenue. If you're projecting $100,000 in sales next year, that puts your COGS at $30,000. The same logic applies to marketing, payroll, and any other cost that moves with revenue.
This is the fastest way to build expense projections for your income statement. Start here, then adjust individual line items where you know costs will change.
Just remember that this model assumes your cost structure stays proportional as you grow. And that's rarely true. Fixed costs like rent don't scale with revenue, so go line by line for anything that doesn't move with sales.
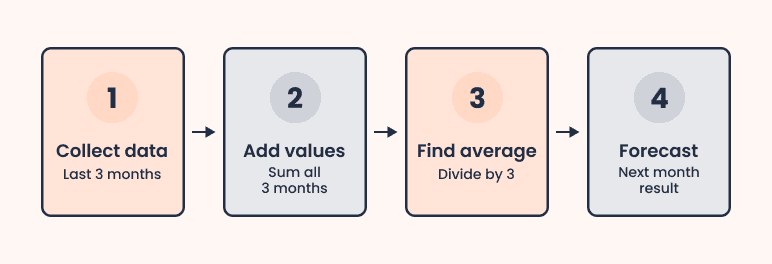
3. Moving average
Rather than basing your next month's projection on a single month's numbers, a moving average takes the last several months, adds them up, and averages them out.
This works especially well for businesses where monthly revenue jumps around. Because it reduces the noise and gives you a more realistic picture.
Example: Your retail store's last three months were $8,000, $10,000, and $9,000. Your moving average forecast for next month is $9,000. That's a far more reliable number than projecting off a December spike of $14,000.
If your business has seasonal patterns, stick to a 3 or 6-month moving average. It keeps your projections grounded and credible.
Though it's a reactive model, it tells you what happened and smooths it out, but it doesn't account for what's about to happen. It works best for stable, established businesses.
But if you're about to launch a new product or run a major promotion, moving average won't capture that upside.
4. Simple linear regression
This model finds the relationship between one input variable and your revenue, then uses that relationship to project future performance.
It works best when you can clearly link one factor to your sales, like marketing ad spend or foot traffic to revenue.
Example: You notice that every $1,000 you spend on ads generates roughly $5,000 in sales. That's your regression relationship. If you plan to spend $3,000 on ads next month, your projected revenue is $15,000.
This model assumes the relationship between your input and output stays consistent over time. But real businesses are messier than that. Ad spend hits diminishing returns, markets change, and customer behavior shifts.
So, use it when you have at least 6-12 months of consistent data showing a clear, repeatable relationship between your input and your output.
5. Multiple linear regression
Think of this as simple linear regression but with more variables in the mix. Instead of one input driving your forecast, you're working with several factors at once to get a more complete picture of what's actually moving your revenue.
It makes sense to use it when multiple things genuinely drive your sales, and a single variable just doesn't tell the whole story.
Example: A retail store owner forecasts monthly sales using three inputs: marketing spend, store square footage, and average local household income. Each factor carries a different weight, and together they produce a more accurate estimate than any one of them could alone.
If you're in a competitive market where several factors move your numbers, this model adds real depth to your projections. But if your data is patchy or inconsistent, the results will look precise but won't actually be reliable.
Only use this model when your data genuinely supports it, not as a way to make projections look more sophisticated than they are.
6. Time series analysis (ARIMA)
This model looks at your historical data and finds the patterns hiding in it. Seasonal cycles, recurring spikes, predictable dips. Once it identifies those patterns, it projects them forward.
It takes more data and more effort than the simpler models, but for businesses with clear seasonal behavior, it's hard to beat for accuracy.
Example: A holiday decoration retailer sees the same pattern every year. Sales spike from October through December, then drop sharply from January through March. Time series analysis picks up that rhythm automatically and builds it into every future forecast.
If you're presenting to investors and have 2+ years of data, this model adds a layer of sophistication that shows you understand your business cycles, not just your averages.
Where this model falls short is that it assumes the future will look like the past. If significant changes in your business or market, like a new competitor, a supply chain disruption, or a consumer behavior shift, time series won't predict.
7. Top-down forecasting
You start with the total market size and work your way down to estimate your realistic share of it.
It's especially useful when pitching to investors who want to see market context alongside your revenue projections. It shows you understand the size of the opportunity and where your business fits within it.
Example: The total US restaurant industry is worth roughly $900 billion. Your city brings in around 0.1% of that, so about $900 million in annual restaurant revenue. If you realistically capture 0.5% of your local market, you're looking at $4.5 million in projected annual revenue.
The math can make almost any revenue number look reasonable. Capturing 0.5% of a large market sounds modest, but that might still mean thousands of customers you have no clear plan to reach.
Experienced investors spot this immediately. Thus, back your top-down numbers with bottom-up projections that show exactly how you plan to get there.
8. Bottom-up forecasting
You build your revenue forecast from the ground up using your actual unit economics: price per unit, volume, and capacity.
This is the most credible model for startups with no historical data. You're not guessing. You're calculating based on what you actually plan to sell.
Example: Your restaurant has 20 seats, turns tables twice a day, charges an average of $25 per ticket, and stays open 300 days a year. Run those numbers: 20 x 2 x $25 x 300, and you get $300,000 in projected annual revenue.
Bottom-up is only as good as the assumptions behind it. Assuming full capacity from day one, perfect conversion rates, or zero slow periods produces numbers that look credible on paper but fall apart under scrutiny.
Make sure every assumption reflects realistic early-stage conditions, not just optimistic ones dressed up in unit economics.
If you're writing your first business plan, use bottom-up for Year 1 and top-down as a sanity check. If your bottom-up number exceeds 1% of your total addressable market, your plan assumptions may be too aggressive.
9. Delphi method (expert consensus)
This one works differently from other financial forecasting models on this list.
Instead of crunching numbers, you gather input from a group of industry experts, compile their projections, and refine them through rounds of feedback until a consensus starts to form.
It's the go-to method when you're entering a new market where historical data and benchmarks simply don't exist yet.
Example: You're opening a restaurant in a neighborhood where no similar business has operated before. You have no benchmarks or comparable sales data to work with.
Instead of guessing, you gather input from local real estate agents, chamber of commerce reps, and existing business owners nearby. You compile their responses and use the consensus to build your first revenue projection.
This method only works if the experts are genuinely credible. If the people you reach out to don't have verifiable expertise or real industry knowledge, the consensus you reach won't add real credibility to your plan.
Document your process carefully and make sure your sources are credible enough to stand up to scrutiny.
10. Scenario-based forecasting
Rather than one forecast, you build three: conservative, moderate, and aggressive. Each reflects a different set of assumptions about how your business performs.
Every business plan should include this because it shows lenders and investors you've thought seriously about the downside, not just the best case.
Example: A SaaS startup maps out three Year 1 scenarios:
- Conservative: 50 paying customers at $99/month = $59,400.
- Moderate: 120 customers = $142,560.
- Aggressive: 250 customers = $297,000
Each has its own assumptions around marketing spend, conversion rates, and churn.
The most common mistake is that the conservative scenario isn't actually conservative. It ends up being just a slightly lower version of the best case. It doesn't show a lender anything meaningful about your downside planning.
Your conservative scenario should reflect what happens if things take twice as long and cost more than expected. That's the version that shows lenders you've really thought this through.
Now that you know financial forecasting techniques individually, here's how all 10 stack up against each other:
| Model | Best for | Data needed | Business plan use case |
|---|---|---|---|
| Straight-Line Forecasting | Steady, predictable growth | 1-2 years of revenue data | Initial revenue projections |
| Percent of Sales Method | Quick expense estimation | 1 year of financials | Income statement expense projections |
| Moving Average | Seasonal or inconsistent revenue businesses | 3-6 months of sales data | Smoothing out revenue projections |
| Simple Linear Regression | Businesses with one clear revenue driver | 6-12 months of paired data | Linking ad spend or traffic to revenue |
| Multiple Linear Regression | Businesses with multiple revenue drivers | 12+ months of multi-variable data | More accurate revenue modeling |
| Time Series Analysis (ARIMA) | Strong seasonal patterns | 2+ years of monthly data | Long-term trend and cycle forecasting |
| Top-Down Forecasting | Market sizing and investor pitches | Industry and market size data | Showing market opportunity in a pitch |
| Bottom-Up Forecasting | Startups with no data | Unit economics only | Year 1 revenue projections |
| Delphi Method | New or emerging markets | Expert input, no data needed | Projections for brand new markets |
| Scenario-Based Forecasting | Every business | Any existing forecast | Conservative, moderate, aggressive plans |
How to pick the right forecasting model for your business
After knowing all 10 financial forecasting methods and techniques, you might be sitting there thinking, "Okay, but which one do I actually use?
The honest answer is it depends on just three things:
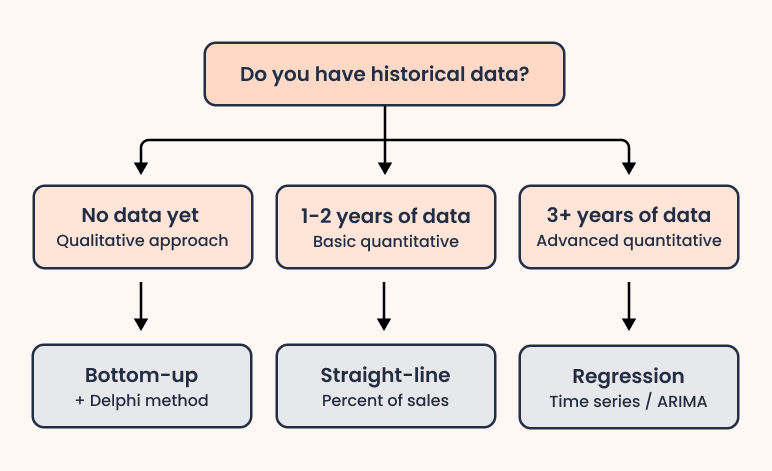
How much data do you have?
This is the first question to ask yourself because your data situation eliminates most of the options right away.
If you have no historical data yet, qualitative models are your only realistic starting point. Bottom-up forecasting and the Delphi method work well here because they don't need past numbers to produce a defensible projection.
If you have 1-2 years of financials, straight-line forecasting and the percent of sales method are your sweet spot. Enough data to identify a trend without overcomplicating things.
If you have 3 or more years of consistent data, you can use regression models and time series analysis. The extra complexity actually pays off at this stage because you have enough history to make the results meaningful.
At what stage is your business?
Pre-launch businesses should lean on bottom-up forecasting paired with the Delphi method if you can access industry experts. You're building from assumptions, so make sure every assumption is traceable and logical.
Existing businesses with a track record should use time series analysis and regression models. Your history is your biggest asset. So use it.
And if your business is scaling fast, scenario-based forecasting becomes essential. One projection won't cut it anymore. You need a conservative floor, a realistic middle, and an aggressive ceiling so you're ready to plan around.
What is the forecast actually for?
Writing a business plan? Start with bottom-up for revenue and scenario-based for your three projections. Together, they cover most of what any lender or investor wants to see.
Applying for a bank loan? Straight-line forecasting paired with a pro forma income statement is usually what lenders expect. Keep it clean and simple.
Pitching to investors? Lead with top-down to show market context, then back it up with scenario-based projections. They want to see the opportunity and the range of possible outcomes.
Common financial modeling mistakes (& how to avoid them)
Most first-time founders make the same mistakes when building a financial model for their business plan. Here are the ones worth watching out for.
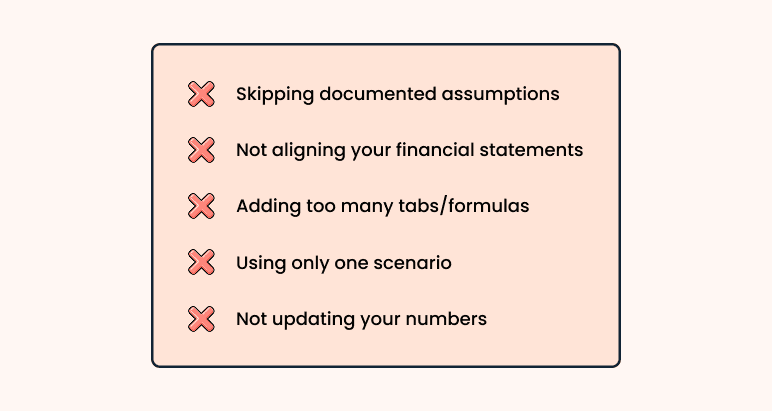
(1) Skipping documented assumptions
You put $120,000 as your Year 1 revenue. A lender asks where that number came from. If you can't explain it, your whole model falls apart in that moment. Every number in your model needs a reason behind it.
Fix: Write down the logic behind every key number. Where did it come from? What research backs it up? Document your assumptions before you build anything else.
(2) Not aligning your financial statements
Your income statement, balance sheet, and cash flow statement are three separate documents that are supposed to work together. If your revenue changes, your cash flow should change too. Most first-time founders don't realize this until someone points it out.
Fix: Use a 3 financial statement model that links all three together so a change in one automatically updates the others. It's the most reliable way to make sure your numbers stay consistent throughout your business plan.
(3) Adding too many tabs/formulas
A model with 50 tabs and hundreds of formulas doesn't impress anyone. It just makes it harder to find errors and harder for a lender to follow your logic. This raises more questions than it answers.
Fix: Start simple. Use a clean 3-statement model that's easy to follow. It's worth more than a complex one nobody can understand.
(4) Using only one scenario
Adding a single set of projections means you've only planned for one outcome. Anyone reviewing your business plan will immediately wonder what happens if things don't go as expected.
Fix: Always build three versions: conservative, moderate, and aggressive. It shows you've thought beyond the best case.
(5) Not updating your numbers
You build the model, submit it, and never open it again. Six months later, your assumptions are outdated, and your numbers no longer reflect your actual business.
Fix: Review your numbers at least quarterly, or update whenever something significant changes in your business.
Don't build your financials first. Write it after your market analysis and operations plan are done. Your numbers should be backed by the research already in your business plan.
Build your financial model using Bizplanr
If you've never built a financial model before, a blank spreadsheet is not the best place to start. It's overwhelming, time-consuming, and easy to get wrong.
Instead, use our free financial model generator. It gives you a solid base for a working financial model without the back-and-forth of building everything manually.
Once you've got the basics down and ready for advanced financial planning, go for Bizplanr workspace. It lets you prepare more complete and accurate financial projections. Here's what you get access to:
- Complete financial overview dashboard
- AI-assisted financial projections
- AI financial advisor
But here's what makes Bizplanr different. It doesn't just help with your financials.
Bizplanr AI even helps you with the other sections of your business plan, from market analysis to operations. This ensures your financial projections are connected to everything else in your plan rather than being a standalone document.
Get Your Business Plan Ready In Minutes
Answer a few questions, and AI will generate a detailed business plan.
Frequently Asked Questions
What are financial forecasting models?
Financial forecasting models are tools that help you predict your business's financial future. Some use your past numbers, some use market research, and some rely on expert judgment when data isn't available. The goal is always the same: turn your best assumptions into projections you can actually defend.
What are the four types of forecasting models?
The four most widely referenced quantitative models are:
- Straight-line
- Moving average
- Simple linear regression
- Multiple linear regression
But honestly, most business plans use a mix of quantitative and qualitative methods, so the number goes well beyond four depending on your situation.
What's the difference between financial forecasting and modeling?
Forecasting is about predicting what will likely happen. You're estimating your revenue, expenses, and cash flow based on what you know right now. Modeling is what you do after that. You take your forecast and ask, "What if things don't go as planned?" One gives you a number to work with. The other helps you prepare for when that number is wrong.
Which financial forecasting method is best for a startup?
Bottom-up forecasting. It's the most practical model for a startup because it doesn't require historical data. You start with your price, multiply it by a realistic volume, and build from there. Pair it with scenario-based forecasting to cover your best and worst cases, and you'll have everything a lender or investor typically wants to see.
How often should you update a financial forecast?
At least once a quarter. If your industry moves fast or you're in an early growth stage, review it monthly. And any time something big changes, a new funding round, a product launch, a shift in the market, don't wait until next quarter. Update it straight away.


Follow Kaylee Philbrick-Theuerkauf