
Running a small business today isn’t what it used to be. The market moves faster, customer habits evolve overnight, and technology reshapes how businesses grow and compete.
That’s why staying on top of the latest small business statistics isn’t just helpful—it’s essential. These numbers tell the real story of what’s happening in the market, what other business owners are doing, and where new opportunities are opening up.
In this blog, I’ve rounded up the most useful and up-to-date stats on small business trends, technology, social media, and growing industries for 2025. Whether you’re starting a new venture or looking to take your business to the next level, these insights will help you plan smarter and make better decisions.
So, let’s dive into the numbers shaping the future of small businesses!
Editor’s Picks: Top Small Business Statistics & Trends 2025
- 65.3% of small businesses globally are profitable, and 9% generate over $1 million in annual revenue.
- 78% of solo businesses worldwide make under $50,000 annually, while only 0.2% surpass $1 million.
- 64% of small businesses start with less than $10,000, and 33% launch with under $5,000. Most (78%) rely on personal savings rather than investors or business credit.
- Small businesses employ nearly half of all private sector employees in the USA.
- There are 34,836,451 small businesses in the United States as of 2025, making up 99.9% of all businesses.
- According to the U.S. Small Business Association, a small business typically has 50 to 1,500 employees and annual revenues between $1 million and $40 million.
- 70% of small business spending goes toward wages and benefits, with inventory accounting for 17%-25% of budgets.
- 18% of small businesses plan to increase digital marketing investment, and 53% are partnering with micro-influencers for targeted campaigns.
- Globally, healthcare, consulting, e-commerce, and technology are leading areas for small business growth.
Small Business Market Outlook
The global small business market was valued at USD 2,572 billion in 2023 and is projected to reach USD 4,985 billion by 2032, expanding at a CAGR of 8.5% between 2024 and 2032.
In the U.S., small businesses employ nearly half of all private sector workers, and over 34.8 million small businesses in the U.S., representing 99.9% of all businesses.
Inflation, labor quality, regulatory changes, and access to capital are the top challenges of small businesses, which directly impact their growth, profitability, and long-term sustainability.
Here’s a deeper insight into the mall business market outlook:
| Metric | Global (2025) |
|---|---|
| Market Size | USD 2.572 billion (2023); projected USD 4.985 billion by 2032 |
| Growth Rate (CAGR) | 8.5% (2024-2032) |
| Employment Impact | Up to 70% of global jobs |
| Largest market | North America |
| Fastest growing market | Asia Pacific |
| Failure rate | 50% of new businesses fail within the first five years |
| Key Drivers | Digitalization, AI adoption, e-commerce, micro-consulting, regulatory changes, government support |
| Business Models | Cloud-based and on-premise; rise of micro-consulting and digital platforms |
| Regional Highlights | Asia Pacific: rapid growth, tech startups; North America: innovation, capital access" |
| Economic Contribution | Backbone of global economies, major contributor to GDP |
| Notable Trends | Cloud migration, AI, e-commerce, flexible work, and regulatory adaptation |
| Support Factors | Government initiatives, funding access, and supportive regulation |
Top Small Business Statistics for 2025
Small businesses are the heartbeats of every economy, and the numbers in 2025 prove it louder than ever. From startup survival rates to digital trends, these stats reveal where opportunities and challenges are heading. Let’s break them down.
1) Small business growth statistics
Small businesses aren’t just surviving — they’re growing stronger in 2025. Let’s take a look at the numbers that highlight this unstoppable momentum.
- In 2025, more than 60% of small businesses globally plan to expand their operations, indicating widespread optimism and growth ambitions. (Source)
- The global small business market was valued at USD 2,572 billion in 2023 and is projected to reach USD 4,985 billion by 2032, reflecting a robust CAGR of 8.5% from 2024 to 2032. (Source)
- There are an estimated 582 million entrepreneurs worldwide, with small businesses comprising 90% of all global companies and providing 50% of jobs worldwide. (Source)
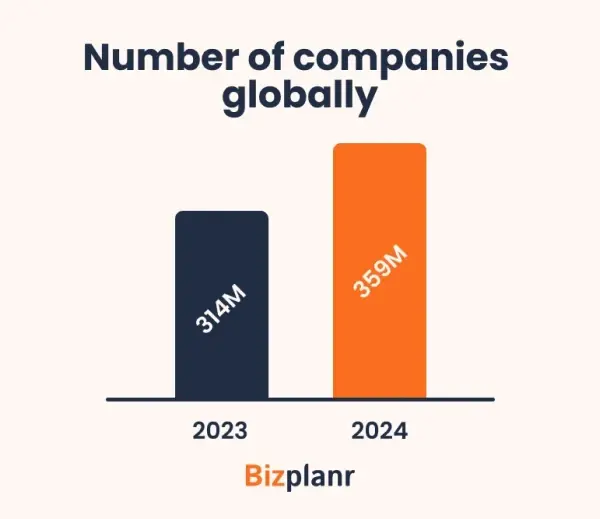
- The number of companies globally rose to approximately 359 million in 2024, up from 314 million in 2023, showing a steady increase in business formation. (Source)
- The small business scene in the U.S. continues its steady climb. In the past year alone, the number of small businesses grew by 0.28%, adding to a total growth of over 9.7% since 2020. (Source)
- In 2025, optimism is fueling small business growth. More than 78% of owners aim to grow, and nearly 7 in 10 believe their financial outlook is bright. (Source)
- In 2025, small businesses in clothing and consulting are seeing the fastest growth, one riding the eCommerce wave, the other thriving on specialized skills and adaptable services. (Source)
- About 50% of small businesses start at home, a trend that has accelerated since the pandemic. (Source)
- In 2025, small business owners earn an average annual salary of $69,119. (Source)
- Nearly half of all small business owners (44%) are between 39 and 54 years old. (Source)
- Around 50% of small businesses make it past the five-year mark, but only 30% survive for a decade or more. (Source)
2) Small business failure statistics
Success stories get the spotlight, but the numbers behind the small business failure rate tell an equally important story. Let’s uncover the hard truths every entrepreneur should know.
- Each year, approximately 595,000 businesses shut down or fail on average. (Source)
- Roughly 79% of small businesses make it through their first year, leaving a 21% failure rate in those early months. (Source)
- A staggering 82% of failed businesses pointed to cash flow problems as a key reason for their downfall. (Source)
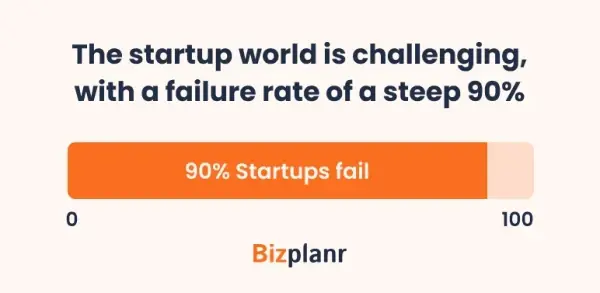
- The startup world is challenging, with a failure rate of a steep 90%. (Source)
- The first year proves challenging for many, with roughly 10% of startups failing to survive it. (Source)
- The “Agriculture, forestry, fishing, and hunting” sector leads in business survival, with just a 12.5% failure rate in the first year, 33.8% by year five, and 49.5% by year ten. (Source)
- It’s a widely shared claim that 90% of restaurants shut down in their first year, earning them a reputation for having the toughest survival odds. (Source)
- Roughly 15.8% of retail businesses close within their first year, leaving an encouraging 84.2% survival rate. (Source)
- A striking 42% of businesses fail because there’s no market demand for their products or services. (Source)
- 29% of businesses fail because they run out of cash, while another 23% close their doors due to not having the right team in place. (Source)
- Entrepreneurs with past failures have a 20% higher chance of success when launching a new startup. (Source)
- Approximately 60% of small businesses aren’t profitable. (Source)
- Within two decades, roughly 75% of fintech startups shut down. (Source)
- A missing business model caused failure in 17% of cases, while 14% faltered from weak marketing, and another 14% from neglecting customer needs. (Source)
3) Small business revenue statistics
When it comes to small businesses, revenue stories are as diverse as the businesses themselves. Let’s break down what the numbers reveal about how much average small business revenue is actually making.
- Across the U.S., the average small business generates about $1.22 million in revenue, contributing to a combined $40.2 trillion from 32.9 million businesses. (Source)
- Small businesses without employees earn an average of $47,794 in revenue, with 27.2 million of them contributing $1.3 trillion in 2020 alone. (Source)
- In a 2023 survey of 1,000+ small business owners, 34% reported earning less than $50,000 in revenue, while just 9% crossed the $1 million mark. (Source)
- Small businesses are responsible for 35.6% of all private sector revenue, collectively bringing in $13.3 trillion. (Source)
- In 2021, small businesses in the U.S. generated $16.2 trillion in revenue. (Source)
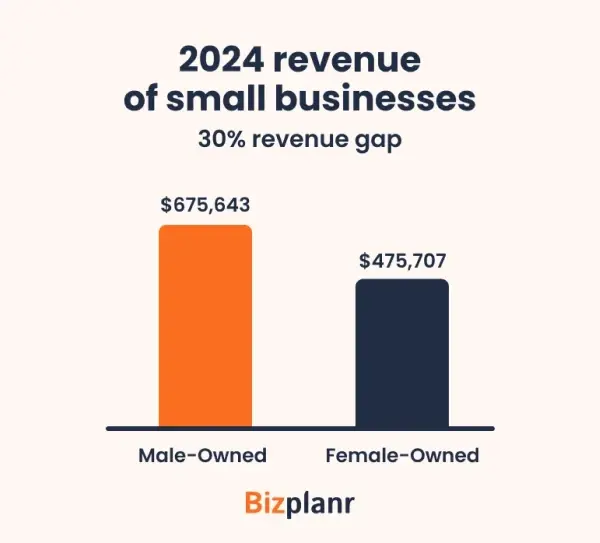
- In 2024, male-owned small businesses earned an average of $675,643, while female-owned businesses averaged $475,707—marking a 30% revenue gap. (Source)
- For small businesses with 1-4 employees, average revenue climbed to $378,000. (Source)
- In 2023, solo-owned small businesses averaged between $44,000 and $46,000 in annual revenue. (Source)
- With average yearly revenue hitting $3.2 billion, modest startup costs of $5,500, and a healthy 39.1% profit margin, this industry stands out for entrepreneurs. (Source)
- Small businesses contribute $13.3 trillion, making up 35.6% of the entire private sector’s revenue. (Source)
- In 2023, a survey showed that 34% of small businesses made under $50,000, and just 9% made more than $1 million. (Source)
- In the United States, around 20 new tech companies each year go on to earn $100 million or more. (Source)
- Businesses that spent 13% of their revenue on marketing typically made up to $10,000 a year. Those spending 7% earned between $10,000 and over $100,000. (Source)
- As of 2024, businesses that invested more in staff salaries earned higher revenue in their first year. (Source)
4) Small business cybersecurity statistics
Cyber threats aren’t just a big-business problem anymore. In 2025, small businesses are facing growing cybersecurity risks that can cost them dearly — let’s look at the numbers.
- Small businesses face 43% of all cyber attacks each year, with 46% of those targeting companies with 1,000 or fewer employees. (Source)
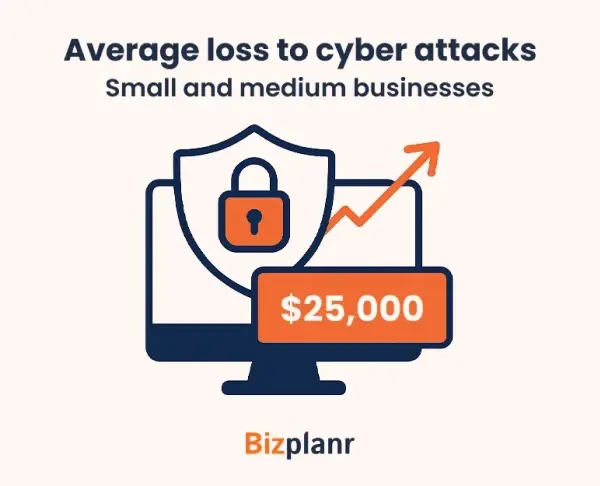
- On average, small and medium businesses lose $25,000 to cyber attacks. (Source)
- In 2020, small businesses were hit by over 700,000 cyber attacks, causing $2.8 billion in total losses. (Source)
- At 18%, malware is the top type of cyberattack small businesses face. (Source)
- 37% of businesses targeted by ransomware attacks had fewer than 100 employees. (Source)
- Employees at small businesses face 350% more social engineering attacks compared to those in larger companies. (Source)
- Only 14% of small and medium businesses are ready to handle a cyber attack. (Source)
- On average, SMBs spend anywhere from $826 to $653,587 dealing with cybersecurity incidents. (Source)
- 83% of small and medium businesses aren’t ready to handle the financial fallout of a cyber attack. (Source)
- Shockingly, 27% of small businesses that have no cybersecurity in place gather customers’ credit card information. (Source)
- 50% of SMBs reported needing at least 24 hours or more to recover from a cyberattack. (Source)
- In 2020, small businesses faced more than 700,000 cyberattacks, causing $2.8 billion in total damages. (Source)
- About 40% of small businesses suffered significant data loss because of cyberattacks. (Source)
- 51% of small businesses targeted by ransomware choose to pay to regain access. (Source)
- Cybercrime costs are expected to rise 15% over the next five years, reaching $10.5 trillion by 2025. (Source)
- 43% of data breaches are caused by insiders, knowingly or unknowingly. (Source)
- 36% of small businesses don’t worry about cyberattacks at all, and 59% of those without cybersecurity think their company is too small to be a target. (Source)
- Due to rising fears of new cyber risks, 76% of small businesses are spending more on cybersecurity. (Source)
- A striking 87% of small businesses hold customer data that’s at risk of theft or damage in a cyber attack. (Source)
- After a data breach, 29% of small businesses quickly brought in cybersecurity experts or expanded their IT teams. (Source)
- The most common cybersecurity tools small businesses adopt are antivirus software (58%), firewalls (49%), VPNs (44%), and password managers (39%). (Source)
- 48% of businesses waited until after a cyber attack to purchase insurance. (Source)
- 47% of small businesses with under 50 employees have no funds set aside for cybersecurity. (Source)
- 36% of small businesses show no concern when it comes to cyber threats. (Source)
5) Small business lending/finance statistics
When it comes to fueling growth, access to financing remains a crucial hurdle for many small businesses. Let’s dive into the latest lending trends and stats shaping the future of small business finance.
- To manage their finances better, 71% of small business owners rely on budgeting software. (Source)
- Around the world, 40% of micro, small, and medium businesses struggle with unmet financing needs. (Source)
- In the U.S., 77% of small business owners are concerned about securing funding for their business. (Source)
- Cash flow problems cause 82% of small businesses in America to fail. (Source)
- Running out of cash is the reason behind 29% of small business closures. (Source)
- The global financing gap for small and medium businesses is estimated at $5.7 trillion, and it could climb as high as $8 trillion. (Source)
- 39% of banks are able to approve small, straightforward loans in just one business day or even faster. (Source)
- 76% of banks can process and approve a small business loan within five working days. (Source)
- Only 42% of small businesses have their financing needs fully met, highlighting a major gap in financial support for small business owners. (Source)
- In 2019, about 43% of small businesses applied for a loan, but this number fell to 37% in 2020. (Source)
- Across Europe, over 80% of small and medium-sized businesses experience payment delays, which hold them back from growing, hiring, and investing in new resources. (Source)
- On average, small business owners take about 5 to 6 months to fully use the funds from their loans. (Source)
- 70% of banks that consider factors beyond credit scores when approving small business loans lend to startups. Likewise, 79% of banks that rarely require personal credit scores also lend to startups. (Source)
- In 2022, male-owned small businesses received 71.6% of approved loan amounts, while women-owned small businesses got only 28.4%—even though women own and operate 39.1% of all small businesses nationwide. (Source)
- According to a survey, business loans are the most common source of funding for small businesses, with 27% of entrepreneurs opting for this option. Other popular funding methods include loans from friends and family, personal savings, investors, and crowdfunding. (Source)
- In Europe, traditional bank loans account for 70% of all external funding for small and medium-sized businesses (SMBs). (Source)
- In 2023, 43% of small businesses applied for a loan to support their growth and operations. (Source)
- The average size of an SBA loan in 2023 reached $446,975. (Source)
- Small banks approved at least part of loan applications for 82% of small business applicants in 2023, while large banks approved only 68%. (Source)
6) Small business owners' statistics
Small business owners are the driving force behind local economies and job creation. Let’s explore the latest numbers that reveal who they are and how they operate.
- There are 4.69 million small businesses in the professional, scientific, and technical services sector, making up 13.5% of all small businesses. (Source)
- Gen X leads with 47% of ownership, Boomers account for 37%, and Millennials make up 16%. (Source)
- According to the 2024 Small Business Trends report, the percentage of Millennial business owners has surged by an impressive 27% compared to 2023. (Source)
- In the USA, the demographic of small business owners includes: (Source)
| Demographic | Small business ownership |
|---|---|
| Women | 44.10% |
| Veterans | 5.50% |
| Hispanics | 5.50% |
| Racial minorities | 22.10% |
- In 2022, there were 16,295 employer firms owned by female veterans and 385,119 owned by minority women, highlighting the growing diversity in small business ownership. (Source)
- Racial minorities own 22.1% of all small businesses in the United States, reflecting the increasingly diverse landscape of American entrepreneurship. (Source)
- In 2021, 27% of all small businesses in the U.S. were family-owned, highlighting the strong role of family-run enterprises in the country’s business landscape. (Source)
- Small businesses estimated owners in the USA: (Source)
| Race/Ethnicity of Majority Owners | Percentage of Small Businesses (2021) |
|---|---|
| White | 85% |
| Asian American | 11% |
| Hispanic | 7% |
| Black or African American | 3% |
| American Indian, Alaska Native, Native Hawaiian, or Other Pacific Islander | 1% |
- In 2021, just 10% of small businesses in the US were co-owned and equally managed by spouses, showing that while family involvement is common, equal spousal partnerships remain relatively rare. (Source)
- Breakdown of small business ownership in the U.S. by gender, based on 2021 data: (Source)
| Ownership Type | Percentage (2021) |
|---|---|
| Majority-owned by Men | 61% |
| Majority-owned by Women | 22% |
| Owned Equally by Men and Women | 14% |
| Not Specified/Other | 3% |
7) Small business employment statistics
When it comes to job creation, the small businesses number of employees might surprise you. These companies may be small in size, but together they employ millions and play a massive role in keeping local economies thriving.
- Over the past 25 years, small businesses have created an impressive 12.9 million new jobs, driving steady employment growth across the country. (Source)
- From 2013 to 2023, small businesses were responsible for 55 percent of all net new job creation in the USA. (Source)
- Black business owners operate around 3.5 million businesses, providing jobs for more than 1.2 million people and generating a combined $217.3 billion in sales. (Source)
- Small businesses make up 99.7% of all companies that have paid employees. (Source)
- In the U.S., 12.07 million small businesses are owned by women, 1.49 million are jointly owned by men and women, 2.66 million are owned by Asian entrepreneurs, and 4.24 million are owned by individuals of Hispanic origin. (Source)
- U.S. employment distribution by Firm Size: (Source)
| Firm Size (Number of Employees) | Percentage of Total Businesses |
|---|---|
| Fewer than 500 | 99.70% |
| Fewer than 100 | 98.10% |
| Fewer than 20 | 89.00% |
| Fewer than 10 | 78.50% |
- Small businesses, defined as firms with 249 or fewer employees, made up 99% of the 5.6 million firms covered by Unemployment Insurance in the first quarter of 2023. (Source)
- As of 2019, veterans owned approximately 331,151 employer firms, representing 6% of all U.S. employer businesses. Additionally, by 2018, veterans owned around 1.4 million nonemployer firms, making up 5.4% of all nonemployer businesses in the country. (Source)
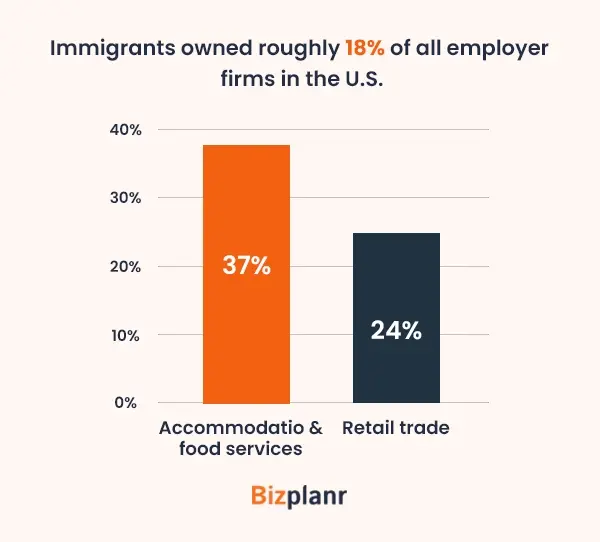
- Immigrants owned roughly 18% of all employer firms in the U.S., with the highest concentrations in accommodation and food services at 37%, and retail trade at 24%. (Source)
- Over 70% of small business owners reported working more than 40 hours a week, while 19% worked over 60 hours weekly, far above the national average of 38.6 hours per week. (Source)
- In the first two quarters of 2020, at the start of the COVID-19 pandemic, small businesses experienced heavier job losses than large firms, shedding 8.0 million jobs compared to 7.8 million in larger establishments. (Source)
- On average, small businesses have 11 employees, compared to the overall average of 24 employees per employer firm in 2021. (Source)
8) Small business technology statistics
Here’s a quick look at key technology trends shaping small businesses today, highlighting how they adopt and use tech to stay competitive, efficient, and connected in a rapidly evolving market.
- About 85% of small business owners report achieving success by integrating technology into their operations. (Source)
- 75% of small business owners believe that AI will play a crucial role in helping them launch new businesses. (Source)
- Nearly 44% of businesses have experienced cost savings as a result of implementing AI technologies. (Source)
- By the end of 2023, 68% of small businesses had established a website, highlighting the growing trend toward digital adoption. (Source)
- For 55% of businesses, growth is the primary motivation behind embracing digital transformation. (Source)
- Social media and digital payment platforms are the most widely used tools among small businesses in the U.S., with 87% using social media and 41% adopting point-of-sale systems, both showing the largest year-over-year growth from 2021 to 2022. (Source)
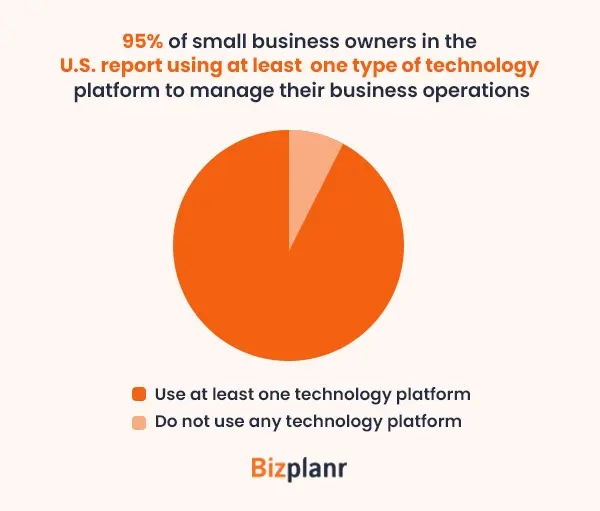
- 95% of small business owners in the U.S. report using at least one type of technology platform to manage their business operations. (Source)
- When asked about how their business started, 60% of owners said their business was launched online, while 40% began as brick-and-mortar establishments. (Source)
- On average, small businesses rely on 4 different types of technology platforms to run their operations. (Source)
- 80% of high-tech adopters reported increased sales, compared to 68% of low-tech adopters. Similarly, 82% of high-tech adopters saw higher profits, while only 68% of low-tech adopters experienced the same. (Source)
- Small businesses leveraging social media are more likely to see growth in sales, profits, and staffing. In fact, 75% of those using social media expanded their workforce between 2021 and 2022. (Source)
- 86% of small businesses that used delivery apps saw an increase in profits from 2021 to 2022. (Source)
- 44% of small business owners strongly agree that digital platforms have helped their businesses operate more efficiently. (Source)
- 36% of small business owners believe that technology platforms played a key role in helping them launch their business. (Source)
- 34% of small business owners believe their business would struggle to survive without access to technology platforms. (Source)
- 46% of small business owners say that technology platforms have helped them discover and attract new customers. (Source)
- SAP (Business Applications and Technology) is utilized by 290,000 companies across more than 190 countries. (Source)
- 68% of companies saw revenue growth from existing streams as a result of technology transformations. (Source)
- 63% of marketers expect their company's digital marketing budget to grow in the coming year. (Source)
- 23% of U.S. small businesses use an AI platform. (Source)
- 82% of small businesses agree that AI has boosted the efficiency of their operations, while 86% say it has improved customer communications. (Source)
- 85% of small businesses expect to increase their technology use over the next two to three years, with 71% planning to adopt at least one form of emerging or cutting-edge technology. (Source)
9) Small business social media statistics
Social media has become an essential growth tool for small businesses, helping them connect with customers, boost brand awareness, and drive sales. Let’s dive into some revealing small business social media statistics.
- Over 96% of small businesses incorporate social media into their marketing strategy. (Source)
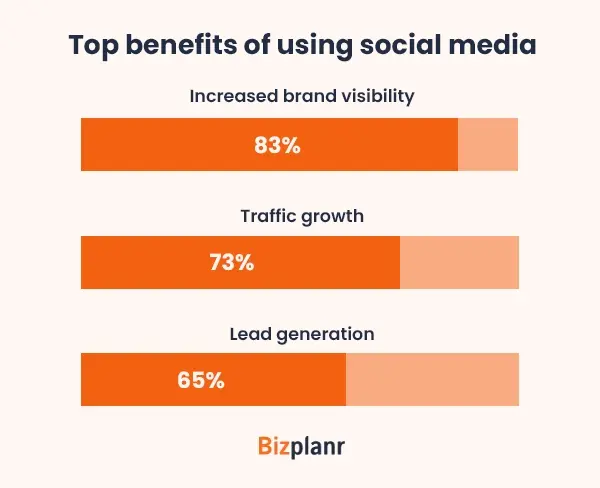
- For 83% of businesses, the top benefit of using social media is increased brand visibility. Additionally, 73% of marketers cited traffic growth, while 65% highlighted lead generation as key advantages. (Source)
- Nearly 48% of consumers are engaging with brands on social media more frequently than they did six months ago. (Source)
- Global ad spending in the Social Media Advertising market is expected to hit US$276.72 billion in 2025. (Source)
- 69% of social media users say they find the most engaging brand content on Instagram, while 44% wish brands posted there more frequently. (Source)
- The popularity and growth of social media marketing differ by business focus, but overall, about 86% of marketers use Facebook, 79% rely on Instagram, and 65% incorporate LinkedIn into their marketing strategies. (Source)
- Facebook remains the top choice for over 91% of B2C businesses, while 86% of B2B marketers prioritize LinkedIn for their marketing efforts. (Source)
- Video marketing on social media is gaining momentum, with social video and TikTok ranking among the top three consumer trends embraced by 47% of respondents. (Source)
- Over 4 million businesses advertise through Instagram Stories each month, with mobile-shot Stories ads outperforming studio-shot ads by 63%. (Source)
Top Small Business Trends 2025
As we step into 2025, small businesses are embracing fresh opportunities and navigating new challenges with innovative strategies and technology. Staying ahead means spotting the trends that will shape growth, customer engagement, and operational success in the year to come. Here’s a look at the top small business trends to watch in 2025.
54% of small business leaders feel ready for market changes with AI and automation. (Source)
More than half of small business owners today feel confident handling changes in the market because they’re using smart tools like AI, automation, and customer management systems. These technologies help them work faster and keep customers happier, something you should definitely consider when running a business someday.
94.2% of the world uses social media, highlighting the rise of community building. (Source)
That’s nearly two-thirds of everyone on the planet! Businesses are spending more on ads and teaming up with influencers to build strong online communities. For example, TikTok ad searches have exploded by over 1,329% in just five years, and working with smaller influencers gets way better engagement. It’s a powerful way to grow a business today, something you should keep in mind.
Social commerce booming: growing 3x faster than e-commerce with $1.2 trillion projected in 2025 (Source)
This means selling directly on social platforms is becoming the new norm, so if you’re thinking about starting a business, learning how to leverage social commerce can give you a huge advantage. Focus on creating engaging content and seamless shopping experiences right where your customers hang out online—that’s where the future is headed.
66% of U.S. customers prioritize sustainability, driving local and eco-friendly business growth. (Source)
More people today care about how products are made and where they come from. If you build your business around being eco-friendly and supporting local communities, customers will trust you more and even pay a little extra. So, when you start your business, think about how you can make it better for the planet and your neighborhood—it really pays off in the long run.
Want to Create a Winning Business Plan?
Answer a few questions and get your plan ready in a few minutes.
What are the fastest-growing small businesses in 2025?
In 2025, several small business sectors are experiencing rapid growth driven by changing consumer needs, technological advances, and market trends. Understanding these booming industries can help entrepreneurs seize new opportunities, identify popular small businesses, and stay ahead in a competitive landscape.
| Fastest-Growing Small Business Type | Growth Rate / Trend (2025) | Estimated Revenue / Market Size | Number of Businesses / Notable Stats |
|---|---|---|---|
| Solar & Renewable Energy Services | Solar power jobs: +276% (2023-2033) | Global renewable energy: $1.21 T+ | Thousands of new U.S. firms annually |
| E-Commerce & DTC Brands | E-commerce sales to double by 2030 | U.S. e-commerce: $289.2 B (2024 est.) | 2M+ U.S. e-commerce SMBs |
| Health & Wellness (incl. Home Care) | Home health care: +22% by 2034 | Global wellness: $2.5 T | 100,000+ U.S. wellness businesses |
| Consulting (Business/Marketing/IT) | Top industry for new SMBs | U.S. consulting: $250 B | 700,000+ U.S. consulting firms |
| Clothing & Apparel (esp. Online) | Top SMB growth area | U.S. apparel: $1.84 T | 100,000+ U.S. small apparel businesses |
| Warehousing & Storage | +8.2% YoY (2025) | U.S. logistics: $455.4 B | Rapid expansion of storage/fulfillment firms |
| Cybersecurity & Data Protection | Top 5 industries to watch | Global cybersecurity: $202.98 B | Thousands of SMBs entering the sector |
| Virtual Reality (VR) Services | +34.7% (2019-2024) | Global VR: $46.6 B (2025) | 2,000+ U.S. VR startups |
| Automotive, Repair & Maintenance | +8.7% YoY (2025) | U.S. auto repair: $81.7 B | 165,000+ U.S. auto repair shops |
| Freight Trucking & Logistics | +6.4% YoY (2025) | U.S. trucking: $11.27 B | 1M+ U.S. trucking firms |
The bottom line
Here we wrap up with the essentials you need to thrive in today’s fast-changing business world.
We’ve explored the small business stats, fastest-growing small business sectors of 2025, and trends that will reshape the small businesses. Backed by real, up-to-date stats that give you a clear picture of where the opportunities lie.
Understanding these trends helps you make informed decisions, whether you’re launching a new venture or scaling an existing one.
And if you're ready to turn those ideas into action, Bizplanr is here to help. It’s an AI-driven business plan platform that lets you create professional, investor-ready business plans in minutes.
Moreover, I hope this overview has sparked fresh ideas and given you the confidence to move forward boldly. Keep learning, stay adaptable, and here’s to your ongoing growth and success—may your business journey be both rewarding and exciting!
Frequently Asked Questions
How many small businesses are there in the U.S. in 2025?
There are 34,836,451 small businesses in the United States in 2025, accounting for 99.9% of all U.S. businesses.
What percentage of small businesses fail within five years?
More than 50% of new small businesses fail within five years.
Which industries are most popular for small businesses in 2025?
Popular industries include technology, healthcare, digital services, retail, renewable energy, salons/spas, real estate, and freelance services
What is the average revenue of a small business?
Average annual revenue ranges from $1 million to $41.5 million, varying by size; businesses with 1–4 employees average $347,000, while those with 100+ employees average $40.77 million per year
How many people do small businesses employ?
Small businesses employ nearly 50% (half) of all private sector employees in the U.S.
What are the fastest-growing small business types?
Fastest-growing types include renewable energy services, virtual reality software, digital consulting, e-commerce, and niche tech solutions
How does technology impact small business success?
Technology—especially AI, automation, and cloud computing—drives efficiency, growth, and competitiveness for small businesses in 2025
What government support is available for small businesses in 2025?
Support includes SBA loans, grants, and technology adoption programs, with additional state and federal initiatives to help with funding and digital transformation


Follow Bizplanr Team