
If you’re spending on ads (which you should be), you need to know where the industry is headed, what’s working, and how consumer behavior is shifting.
Advertising trends change fast, and what worked last year might not deliver the same results today.
Well, this extensive compilation of 2025 top advertising industry statistics is what you need. We’ve gathered insights for global ad spend, mobile ads, influencer ads, social media ads, and everything in between—all compiled in this blog post to give you a quick macro overview of where the industry stands.
Top Advertising Industry Statistics 2025 (Top Findings)
- Alphabet will generate over $200 Billion net digital ad revenue in 2025
- Emails with a video have a 16% higher open rate
- Google ads offer an average CTR of 5.07%, which is significantly (double) higher than other platforms
- Paid YouTube mobile advertising is 84% more likely to receive viewers' attention than TV advertising
- 46% of consumers use social media as their primary product discovery source
- 3 in 10 consumers would change brands based on creator content
- Video content can increase conversion rates by up to 70%
- The Global mobile ad spending is expected to exceed $400 billion in 2025
- Native mobile ads deliver 8.8 times higher CTRs than traditional display ads
Advertising Industry Overview
The advertising industry has predominantly turned digital. And while the traditional methods still persist, it’s no longer a question of traditional vs digital.
Marketers today are using traditional advertising mediums to complement their digital advertising ventures while investing heavily in the latter.
With global ad spending expected to hit $1,158 billion (1.15 trillion) in 2025, most budgets are flowing into search, social media, and CTV ads. Meanwhile, traditional formats like TV, print, and out-of-home (OOH) advertising are evolving to support digital campaigns through cross-channel marketing.
As marketers chart their advertising strategies for the upcoming quarter, it's important to have a detailed understanding of how different advertising channels perform at a micro level.
Read on to explore top advertising industry statistics across platforms, the impact of AI and automation, and key insights shaping the industry in 2025.
Top Advertising Industry Statistics 2025
We’ve gathered fresh, up-to-date insights straight from the top industry publications and research reports—no outdated stats that make you feel like you’re back in 2005.
From the top advertising channels to ROI, conversions, budget cuts, and trends—we’ve got a list of numbers (that matter) with power-packed insights.
1. Global Advertising industry statistics
The advertising industry is bigger than ever, with marketers spending more and shifting budgets toward digital channels.
Let’s check these global stats that may help you understand the advertising industry from a bird's point of view.
The Global Internet advertising revenue is projected to reach 663 billion by 2027 (source)
This includes revenue from all forms of digital ads, such as search ads, display ads, social media ads, video ads, and programmatic ads. The rise in internet penetration and mobile device usage globally will play a significant role in driving this growth.
Global ad spending in 2024 was $1.03 trillion (source)
This includes advertising investments made by businesses, globally, on online and offline channels. Of this digital ad spend including search and social media was $719.2 billion. That’s nearly 70% of the total ad spend.
In 2025 digital channels will attract nearly 61 percent of the global advertising expenditure (source)
At the same, the ad spending on TV will remain near about the same, taking the share of 22%. The print and out-of-home (OOH) media will tie in third place, each with a 5.7-percent share.
South Asia recorded the highest ad spend expansion among world regions in 2024 (source)
Between 2023 and 2024, ad spending in South Asia grew by 12%, the only country to record a double-digit expenditure growth rate. The ad expenditure growth rate in the U.S. and Canada recorded a 7.6% combined increase.
The worldwide advertising expenditure on mobile gaming is expected to reach $130.9 million in 2025 (source)
With over 1.9 billion gamers worldwide, the mobile gaming industry presents a massive opportunity for advertisers. Avid players spend more than 20 hours per week gaming, creating high engagement levels for in-game ads.
Ad spending in the Search Advertising market worldwide is forecasted to reach $351.50 bn in 2025 (source)
Amongst the top 3 priorities of marketers, Search advertising stands second. In 2025 marketers are expected to spend/reallocate a major chunk of their budgets to paid search endeavors.
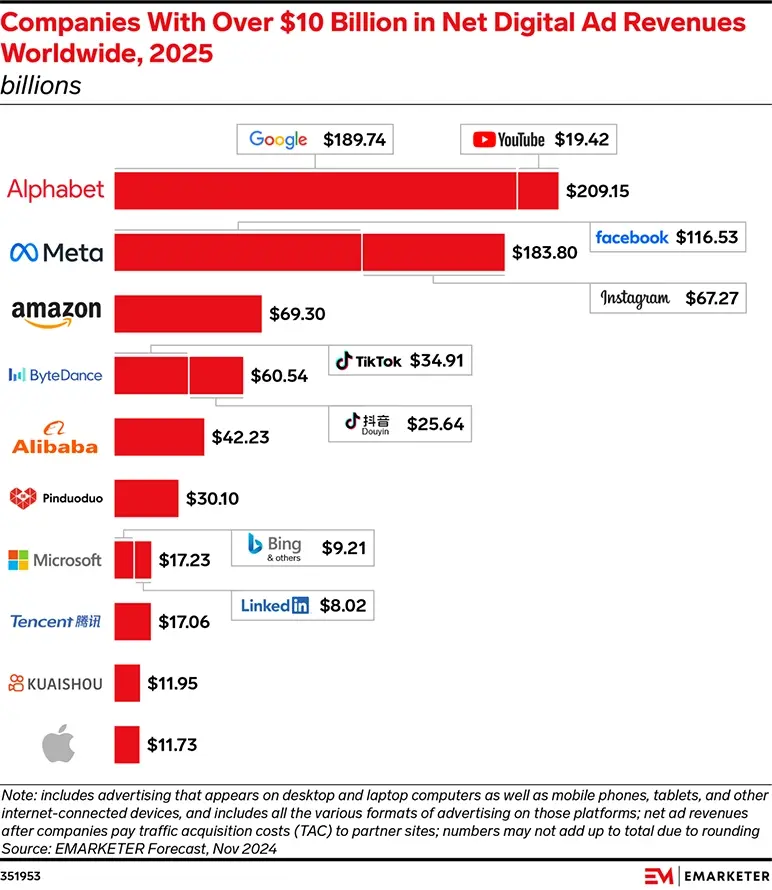
Alphabet will generate the highest (over $200 Billion) net digital ad revenue in 2025 (source)
This is the highest any advertising company will reach that threshold. Meta and Amazon will take the second and third positions, expected to generate $183.8 Billion and $69.30 Billion respectively.
2. Traditional advertising statistics
Although declining overall, certain traditional ad channels still deliver strong returns. In fact, when paired with digital campaigns, formats like TV, print, and trade expos are a valuable part of a multi-channel strategy.
Nearly 50-60% of marketers will maintain their ad spending on radio/audio, TV (national and local), and print media. (source)
Although ad spending on radio/audio, print, and television has overall declined since 2022, some marketers intend to maintain their investments
in these channels. More specifically so, their investments in traditional TV.
That said…👇
Commercials during live sports generate 24% more engagement than other programming (source)
Traditional TV is still important, especially when it comes to sports. Sports will keep attracting big audiences and advertisers.
🤔Did you know: The Super Bowl ads for 2025 were sold by Fox Corp for $7 million each?
Women’s sports only made up 3% of the total spending on sports TV ads in 2024 (source)
The total spending on sports TV ads in 2024 was $8.5 billion and only 3% of it went to women’s sports. This leaves plenty of room for growth, especially since streaming platforms like Netflix have been bulking up its women’s sports portfolio.
Only 43% of TV ads even get looked at (source)
On average, a 30-second television ad gets 13.8 seconds of attention. But one in four commercials plays out to an empty room. That said, 71% are always holding their phones while watching television.
Spending on CTV (Connected TV) is expected to remain among the top 3 media channels for marketers in 2025 (source)
As consumers switch to streaming services with ad-supported options, CTV will remain the top priority for marketers to capture their target audience’s attention. This particularly applies to industries such as auto, quick-service restaurants, retail, travel, and entertainment.
The US B2B trade show market is expected to reach $16.28 billion in 2025 (source)
The market for B2B trade shows has been growing steadily since 2023, as businesses recognize the value of in-person networking and lead generation. This is despite the growing dominance of digital marketing.
Newspaper ad spending is expected to experience an annual decline of 3.71% from 2024 to 2029 (source)
By 2029, the number of readers in the Newspaper advertising market is predicted to reach 1.0bn users. Marketers would be focused on digital magazines and news platforms as the viewership on these platforms grew substantially.
The global billboard and outdoor advertising market is expected to grow at a CAGR of 7.9% between 2023 and 2030 (source)
However, with the advent of interactive and digital billboards, static billboards will see a significant drip. Consumers expect to see more of 3D and out-of-the-home billboards to remain engaged.
3. Email advertising statistics
Emails are the most effective forms of advertisements despite the growing channels and avenues to reach customers. Prioritize data collection, analysis, and utilization to build informed email strategies.
88% of consumers check their emails every day (source)
Not only that, 39% check their emails 3-5 times a day. Why?
To get work updates, communicate with friends and family, and check discount offers from brands. Ahem! Nearly 40% fall in the last category. Of course, businesses need to monetize emails with effective ad campaigns.
79% of consumers will engage with a personalized email (source)
Personalization fosters loyalty. If the product being marketed is relevant to the users, they are 54% more likely to open the mail. Besides, if the personalization extends beyond name email is most likely to get opened.
52% of consumers would pay for an ad blocker (source)
Brands should strike a balance between staying top-of-mind and respecting consumer boundaries to foster long-term relationships with their audience.
81% of consumers will unsubscribe if a brand is sending excessive messages (source)
Email (35%) and text (26%) are the most irritating channels when consumers are bombarded with excessive messages. There’s a sweet spot to the number of times your customers want to see you in their emails. Decode that.
Emails with a video have 16% higher open rate (source)
Static ads are out. To outperform your email ads, start adding interactive media and videos to them. The same study suggests that such emails have 26% more engagement than normal email ads.
Email offers an average ROI of 36:1, meaning for every $1 spent marketers get a return of $36 (source)
The growing prominence of social media doesn’t reduce the effectiveness of good old email ads. Well, you need videos and a lot of interactive elements these days. But the gist of the story—use emails, if you still aren’t.
Email My Cart email campaigns resulted in 54.9% conversions (source)
Surprisingly less than 1% of marketers send email my cart emails leaving behind a huge opportunity, especially for an eCommerce business.
26.5% of email professionals consider conversion rate as a key metric to measure the campaign effectiveness (source)
Conversion rate is the number of viewers who converted as a share of the total number of viewers. Conversely, 24% of marketers chose CTR—the number of clicks an email receives as the most important metric.
B2B marketing emails have a comparatively lower open rate (15.14%) than B2C emails (19.7%) (source)
However, B2B (3.18%) has a higher click rate than B2C (2.09%). That means B2B businesses have considerable potential to convert their customers by leveraging the right email campaigns.
Consumers who purchase products through email spend 138% more than those who don’t receive email offers (source)
E-commerce businesses that leverage well-crafted email offers can boost conversions, increase customer retention, and maximize revenue.
4. PPC advertising statistics
PPC isn’t limited to Google Ads. Restricting your advertising efforts to Google could mean missing out on specific audiences that platforms like Facebook, YouTube, and other prominent channels can effectively reach.
In 2025, diversify your paid search campaigns to enhance reach and conversions.
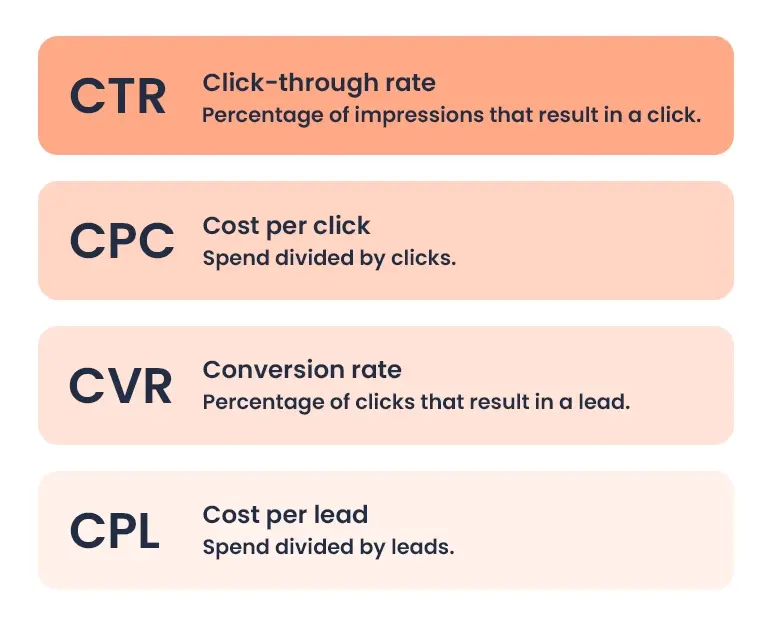
Before we explore the stats, here are a few terms to get familiar with:
Marketers are expected to spend $138.7 billion on paid search in 2025 (source)
Paid search will see the highest investment among digital ad channels, followed by social media, video, and CTV. As competition grows, brands are increasing budgets to secure top placements and optimize performance through AI-driven bidding and audience targeting.
Google has the highest( 87.34%) search engine market share in the US (source)
Google Shopping Ads are responsible for 76.4% of all retail search ad spend in the US. Targeting your PPC campaign on Google is likely to offer better conversions and click-through rates.
Speaking of… 👇
Google ads offer an average CTR of 5.07%, which is significantly (double) higher than other platforms (source)
While nearly 86% of industries saw an increase in CPC (+10.43%) the cost per lead has also increased significantly by 24.61%.
The average click-through rate for Facebook ads across all industries is 1.57% (source)
The industries with the highest average click-through rates were:
- Real Estate: 2.60%
- Arts and Entertainment: 2.59%
- Travel: 2.20%
Well, Facebook isn’t the only social media platform where you can run your PPC campaigns Here’s a quick table discussing CTR, CPC, and ad formats for different social media platforms.
| Platform | CTR | CPC/CPV | Ad formats |
|---|---|---|---|
| 1.57% | $1.86 |
|
|
| YouTube | 0.65% | $0.048 |
|
| 0.88% | $3.35 |
|
Lead campaigns on Facebook offered higher CTR than traffic campaigns (source)
While the click-through rate for lead campaigns was 2.53%, the same for traffic campaigns was 1.57%. On average the cost per lead for Facebook ads remained $21.98.
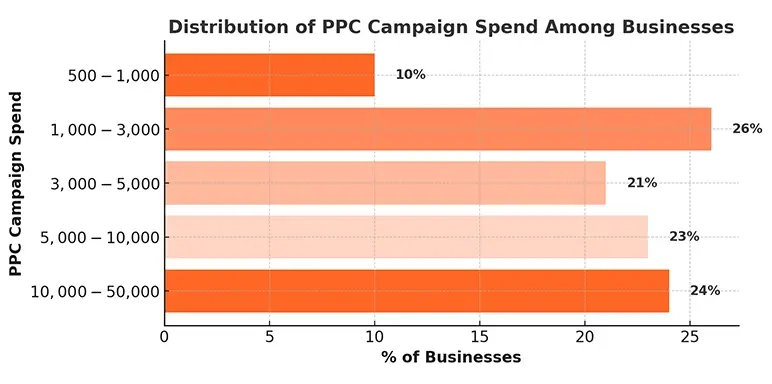
The average monthly PPC campaign cost ranges from $100 to $10,000 for small to mid-sized companies (source)
Spending on X axis, % on Y axis
PPC has an average ROI of 200% (source)
For every $1 spent, businesses get an average return on investment (ROI) of $2 on a PPC campaign. Hal Varian, the Chief Economist at Google, developed this estimate based on observed cost-per-click activity across a large sample of our advertisers. However, this was back in 2009.
Instagram’s ad revenues hit $70.9 billion in 2024 (source)
With over 1.4 billion users worldwide, Instagram continues to dominate as a top platform for advertisers. The platform can deliver high engagement, particularly through visual and video formats like Reels and Stories.
63% of people click on a Google Ad (source)
33% of these people click on a search ad because it directly answers their search query. 26% do so when they see a familiar brand, and 20% just click on a Google ad because it’s listed above other search results.
33% of Amazon and YouTube users engage with an ad when it’s from a familiar brand (source)
Established companies with well-known products can leverage these platforms for PPC to enhance engagement, build further brand loyalty, and drive purchase intent.
70%-80% of users ignore sponsored search results (source)
A User-Centric eye-tracking study revealed that 70-80% of participants ignored paid ads located on the right side of search engine results pages (SERPs). All 24 participants, whether using Google or Bing, focused solely on the organic search results for their queries.
Which brings us to the last in this sequence👇
Nearly 41% of marketers consider consumer ad avoidance/ad blindness to be their largest concern while proposing marketing initiatives. (source)
Audiences are tuning out traditional ads or skipping them entirely. To stay effective, brands are shifting to more engaging formats like conversational ads and personalized messaging. Native placements and AI-driven targeting are also helping ads blend naturally into the user experience.
5. Social advertising statistics
Social media is among the top 3 priorities for ad marketers today.
From Facebook to X, Instagram, LinkedIn, and Pinterest—these platforms have grown tremendously in terms of user base and engagement. Naturally, brands allocate more dollars to these platforms to grow their overall reach.
Between 2022 and 2025, the ad spending on social platforms has grown by 21% (source)
In 2025, nearly 68% of digital marketers plan to increase their social media ad spending making it the fastest-growing media channel. This shift underscores the growing importance of social media in shaping advertising strategies and reaching target audiences effectively, compared to traditional channels.
The average ad spending per internet user in the 'Social Media Advertising' segment will reach $265.17 in 2028 (source)
Between 2023 and 2028, the ad spending per internet user is expected to grow by 14.41%.
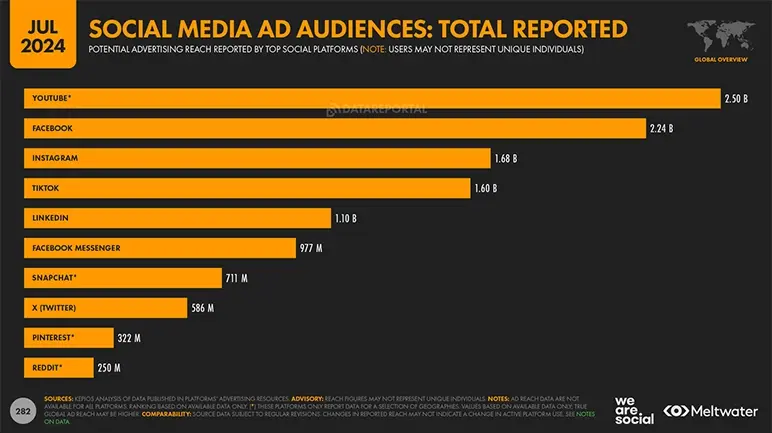
Youtube (2.50 B) followed by Facebook (2.24 B) and Instagram (1.68) has the highest advertising reach (source)
Note that these statistics report potential ad reach for audiences aged 18 and above. If it were 13 and above, TikTok would be positioned over Instagram.
Amongst the marketers whose advertising investments will increase in 2025, 58% will spend more on YouTube (source)
With over 2.49 billion active users and 100 million paying subscribers, YouTube stands out as the top platform for ad spend growth, offering unparalleled reach and engagement opportunities across diverse audiences.
Paid YouTube mobile advertising is 84% more likely to receive viewers' attention than TV advertising (source)
According to research, video ads on YouTube gain 1.8 times more attention than ads on social media platforms. In terms of skippable or non-skippable ads, 29% of marketers consider the former more effective than the latter.
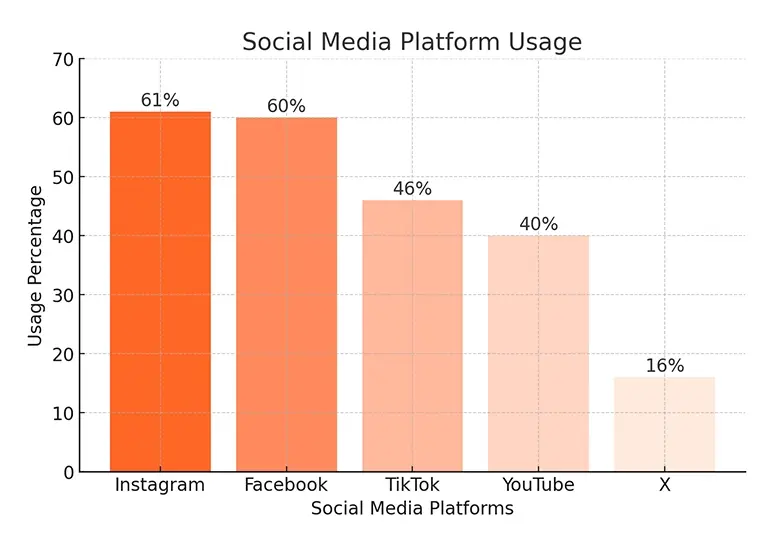
46% of consumers use social media as their primary product discovery source (source)
Here are some top social media platforms for product discovery:
Instagram: 61%
Facebook: 60%
TikTok: 46%
Youtube: 40%
X: 16%
Social commerce drove over $90B in sales in 2024 (source)
70% of social commerce is concentrated in beauty and fashion verticals. Potential customers are increasingly searching for products they need on social media rather than Google, making it a prime spot for advertisers to play their strategies.
Two and a half seconds. That’s how much attention it takes to imprint memory. But fewer than 20% of social media ads get there (source)
Familiarity, favorability, and consideration are among the few metrics that contribute to high attention. High-attention media platforms deliver a 65% lift in business effects like profitability and customer acquisition.
Four in ten adults will share OOH ads on their social media at least some of the time (source)
For best social OOH results provide something of value in your campaign. This can be in the form of entertainment, education, or something more tangible. The more they share, the quicker you get access to your audience’s audience.
6. Outdoor advertising statistics
As consumers shift between digital screens and the physical world, out-of-home (OOH) advertising builds a constant presence, evolving with the times.
In recent years, out-of-home (OOH) channels have also gone increasingly digital with Digital out-of-home that drives the industry's expansion worldwide.
This moment of transformation suggests that the sector is ready to revolutionize the presentation and distribution of outdoor ads.
Out-of-home (OOH) has one of the highest attention mediums in advertising (source)
Out-of-home campaigns have an average 12 seconds of total attention span, which is nearly 50% more than the average of any high-attention platform.
DOOH generates 3.2x the neuro response and memory activity compared to traditional static canvases (source)
Digital out-of-home is consumers’ favorite advertising medium and is also most likely to drive action. Nearly 49% of consumers say that DOOH is likely to make them take action.
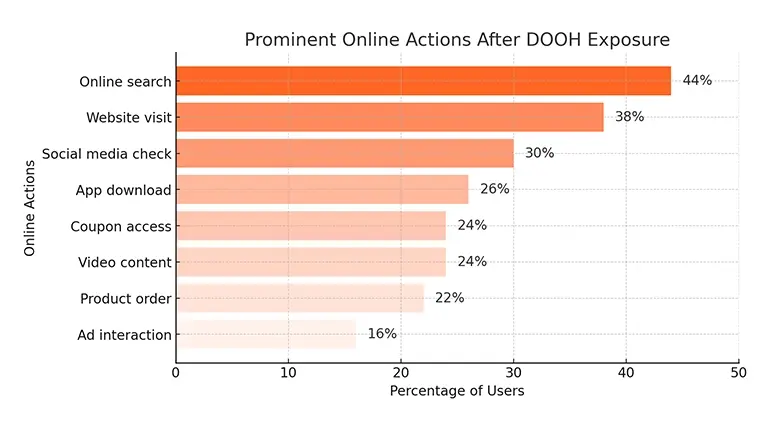
29% of consumers will visit the store and 22% will order products online after exposure to a DOOH ad (source)
Prominent online actions after DOOH exposure based on priority
- Online search- 44%
- Website visit- 38%
- Social media check- 30%
- App download-26%
- Coupon access- 24%
- Video content- 24%
- Product order- 22%
- Ad interaction- 16%
7. Influencer & Creator economy advertising statistics
Brands are shifting ad budgets toward partnerships with content creators. As the demand for authentic, expert-driven voices continues to rise, influencers are becoming a key part of a brand’s advertising strategies.
Certain long-term creator partnerships can cut cost per lead by 30-40% compared to ads on Meta and Google (source)
Creators have become one of the top growth drivers in less than three years. High-value creator partnerships can single-handedly drive more than 50% of your media network reach and demand.
86% of leaders believe it’s likely that AI-generated influencers or social media avatars will replace influencers by the end of 2025 (source)
This assumption is not without doubts. Influencers, particularly micro and macro influencers, have shown the best ROI in 2024, building trust through genuine connections with their audiences.
Marketers of B2B and B2C brands are spending 50-74% of their marketing budget on influencers and content creators (source)
For B2C brands, influencers will help boost product visibility and sales by tapping into niche communities. For B2B marketers, content creators will play a key role in developing trust within professional networks by gaining positions as thought leaders.
Three in ten consumers would change brands based on creator content (source)
As consumers get more and more picky about the influencers they choose, brands need to allow creators to speak in their own voices. If the creator isn’t plausibly someone who would use your products, they don’t possess the credibility to transfer! That’s why alignment is so important to a successful collaboration.
Nearly 2/3rd of the consumers exposed to influencers in OOH ads are driven to take action (source)
Influencers in OOH are needle movers. They drive high-quality perceptions, trustworthiness, memorability, desirability, and luxury.
8. Video advertising stats
Online videos have an audience reach of 92% across the globe. Compared to any other formats, video ads drive maximum ROI, conversions, and reach.
Only 36% of the marketers incorporated videos in their paid advertising ventures (source)
While a significant number of marketers produce video content, only 42% incorporate videos into their paid advertising efforts. This indicates that a majority are not leveraging the high engagement and conversion potential that video ads offer.
51% of marketers have started using AI to create and edit video ads (source)
The easy accessibility of generative AI tools has made it possible even for small businesses on limited budgets to incorporate video marketing in their strategy.
88% of video marketers say video has helped them generate leads (source)
Given that video ads bring the highest ROI, it’s about time now that marketers start experimenting with video ads to grow their reach, conversions, and bottom funnel sales.
LinkedIn is the most widely used video marketing platform with 70% of video marketers using it (source)
B2B brands have been increasingly leveraging video ads to make targeted impressions amongst their customers. It’s one of the most effective channels for B2B markets.
Video content can increase conversion rates by up to 70% (source)
However, if we consider the engagement rate, it can be up to 300%. Meaning, that for every 100 users who view a standard text or image-based ad, a video ad could drive up to 3 times more interactions—whether it's clicks, likes, shares, or comments.
47 million people in the US made a purchase after watching a video ad on Instagram (source)
Shoppable video ads and influencer collaborations played a huge role in driving these conversions. Brands, especially in the fashion, beauty, and travel industries, need to invest in interactive video ads to bring conversions and engagement through Instagram.
31% of marketers believe that short-form videos offer them the highest ROI (source)
Be it YouTube shorts, TikTok, or Instagram reels—these platforms allow brands to experiment with short-form content, test different styles, and quickly see what resonates with their audience. Shoppable video ads have seen maximum conversions on these platforms.
E-commerce video ad sets have 20% more conversions than regular videos on Facebook (source)
eCommerce videos in 9:16 formats along with audio and Advantage+ Catalog ads had 20% more conversions per dollar, compared to ad sets without Advantage+ Catalog ads.
9. Mobile advertising stats
With smartphones dominating screen time, mobile advertising continues to drive a massive share of digital ad spend. From in-app ads to mobile video and social media promotions, brands are optimizing campaigns for mobile audiences.
Mobile advertising accounted for over 60% of total digital ad revenue in 2024 (source)
The surge in mobile ad revenue can be a result of increased in-app advertising, social media ads, and mobile video formats. As screen time on smartphones continues to rise, mobile advertising is set to remain the backbone of digital ad spending.
That said...
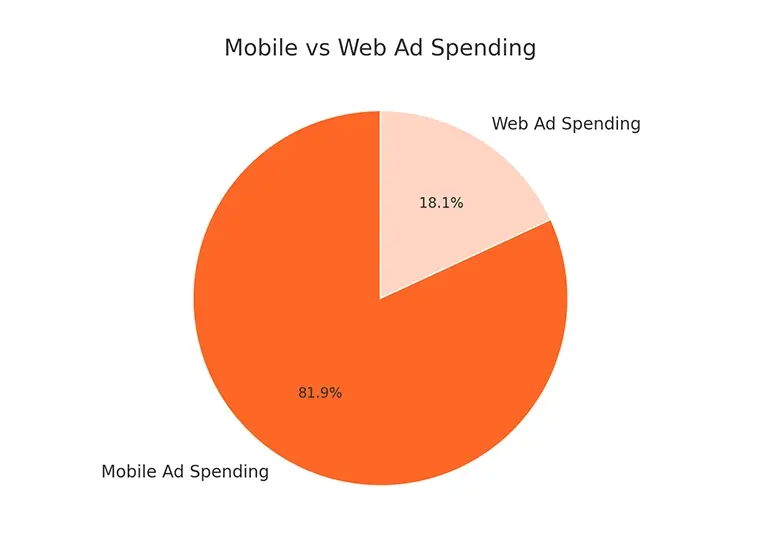
The Global mobile ad spending is expected to exceed $400 billion in 2025 (source)
A significant 81.9% of this spending will be on in-app advertising, reflecting the dominance of mobile applications over web-based ads. As consumers spend more time in apps—especially on social media, gaming, and streaming platforms—advertisers are prioritizing in-app ad placements for better engagement, advanced targeting, and seamless user experiences.
The US leads the race among countries spending significantly on mobile ads (source)
The mobile-first approach is no longer limited to your websites. An average user is spending nearly 4 hours 30 minutes (57% of their online time) on their mobile devices every day, increasing the CTR on your digital ads by 60-70%.
Native mobile ads deliver 8.8 times higher CTRs than traditional display ads (source)
In terms of ad formats, native ads offer higher engagement than display ads by 20-60%. Owe it to their non-intrusive nature and alignment. If marketers can leverage AI and dominate personalized ad formats, they can expect an additional 15-20% revenue growth from native ads.
Playable interstitial (full-format) ads make up 75% of gaming mobile ads (source)
Full-screen ads offer higher CTR, engagement, and visibility compared to banner ads. Such ads avoid banner blindness, so if you incorporate better storytelling, the ad will indefinitely increase user interaction.
The U.S. SMS marketing market size is expected to reach $9.96 billion by 2030 (source)
The advent of Rich Communication Service (RCS), coupled with technologically advanced smartphones, is helping marketers make their promotional messages more interactive and creative to attract customers. Through SMS, companies are providing special discounts and tailor-made offers that can eventually develop enhanced customer relationships.
There are around 496 million ad-blocking users worldwide specifically for mobile (source)
Mobile ad blocking now accounts for 55% of all ad-blocking activity, highlighting a major challenge for advertisers relying on digital placements. In total, 912 million people use ad blockers globally, with nearly one-third (32.2%) of US internet users actively avoiding ads.
10. Advertising technology stats
Generative AI has changed the shape of the advertising industry, making ad creation, targeting, and optimization more efficient than ever. From content automation to lead generation and performance tracking—these technologies are helping brands deliver personalized ads at scale.
63% of marketers consider Generative AI to be the top advertising trend that will dominate in 2025 (source)
Nearly 75% of marketers are using Generative AI or integrating custom GPTs within their tech stack to streamline their omnichannel ad workflows. Data analysis, market research, image generation, and copywriting are amongst the top use cases of AI for ad marketers.
80% of the marketers using AI agree that AI is living up to the hype (source)
Creative automation is empowering brand and performance marketers to streamline the process of creating ad content at greater speed, velocity, and efficiency.
Emotional campaigns have 3.5x more impact than rational ads (source)
Emotional campaigns are 80% better at driving word of mouth and social sharing, 52% better at building mental availability, and 94% better at creating a distinctive image.
Nearly 55% of marketers use AI to create artwork for ad campaigns (source)
More than 70% of these marketers are using AI to automate their campaigns. And while they are convinced of the positive AI impact, creatives remain the biggest challenge with AI.
The use of AI for email nurturing resulted in 82% higher conversion rates (source)
The use of AI to understand user intent can help deliver hyper-personalized email that has 30% better open rates and 50% enhanced click-through rates.
47% of marketers have a clear understanding of how to measure the impact of AI in their advertisement campaigns (source)
With AI, marketers can easily go from A/B testing to A to Z testing helping them evaluate which ads are the most likely to perform the best with their audience.
The Bottom Line
That’s a wrap on the top advertising statistics shaping 2025.
Overall the future of advertising will be dominated by data, AI-powered automation, and cross-channel strategies. Rather than increasing ad budgets significantly, brands will focus on reallocating budgets for better efficiency and higher ROI.
The predictions for 2025 seem promising both in terms of revenue growth and advertising effectiveness.
That said, taking the time to create a solid advertising plan should be the first step. It’ll help you allocate budgets wisely, reach the right audience, and get better results.
Frequently Asked Questions
How big is the advertising industry?
The global advertising industry was $1.03 trillion in 2024 and is expected to grow further, reaching $1.15 trillion in 2025.
How many advertising agencies are there in the US?
As of 2024, approximately 14,273 advertising agencies are operating in the United States.
What industry spends the most on advertising?
The retail industry leads in advertising expenditure, with digital ad spending projected to reach $92.2 billion in the U.S. by 2025.
How big is the online advertising industry?
The global digital advertising market size was estimated at USD 488.4 million in 2024 and is expected to grow at a CAGR of 15.4% from 2025 to 2030.
How fast is the advertising industry growing?
The advertising industry is growing at a CAGR of 9.5% and is expected to be a $1.15 trillion industry in 2025.


Follow Bizplanr Team