
The bar and nightlife industry isn’t what it used to be—it’s bigger, bolder, and changing faster than ever. From the rise of premium cocktails to the growing demand for alcohol-free options, today’s consumers are rewriting the rules.
In this blog, we’ll dive into the latest bar industry statistics, uncovering market sizes, growth trends, and surprising insights you’ll want to know for 2025.
Whether you run a bar, plan to invest, or just love the scene, these numbers will give you a fresh, inside look at what’s really happening behind the bar.
Let’s get started.
Top Bar Industry Statistics 2025 [Top Findings]
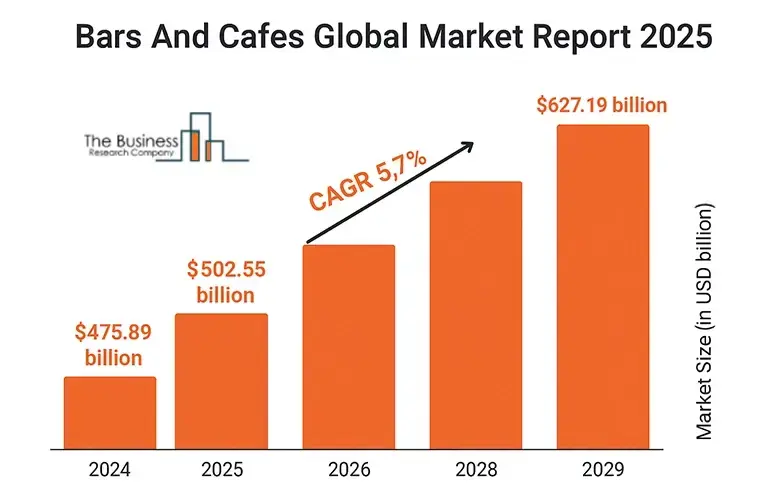
- The global bars and cafes market is expected to grow from $502.55 billion in 2025 at a CAGR of 5.6%, reaching around $627.19 billion by 2029.
- The bars and nightclubs segment is projected to rise from $94.03 billion in 2024 to $99.08 billion in 2025, marking a 5.4% CAGR. By 2029, it’s anticipated to reach $120.37 billion.
- In the U.S., total alcohol sales, including retail and on-premise, hit $162.3 billion, with more than 67,000 bars and clubs in operation as of 2022. The industry is growing at a steady annual rate of 2.2%.
- The market size of the Bars & Nightclubs industry in the United States has been growing at a compound annual growth rate (CAGR) of 12.2% between 2020 and 2025.
- Sales of non-alcoholic beers, wines, and spirits have jumped 31% over the past year.
- The functional drinks market is experiencing solid growth, rising from $46.29 billion in 2024 to an expected $49.17 billion in 2025, with a CAGR of 6.2%.
- In 2022, the number of employees in the U.S. bar and nightclub sector saw a sharp rise, surpassing 570,000, a significant jump from 353.85 thousand the year before.
- In 2023, Hooters topped the list of sports bar chains in the United States, generating around $867 million in sales. Other notable names in the ranking included Dave & Buster's and Miller's Ale House.
- The U.S. wine bar market saw a modest increase from 2022 to 2023, rising from $3.07 billion to $3.1 billion.
- When choosing alcoholic drinks, 46% of consumers consider how the product might affect their health.
- The ready-to-drink (RTD) category has seen impressive growth, with sales climbing to $4.8 billion since these pre-mixed beverages started gaining popularity.
Bar Industry Overview
The global bar industry is expected to generate $502.6 billion in revenue by 2025, growing at a steady CAGR of 5.6% as it continues to recover from pandemic-related disruptions.
In the United States alone, the bars and nightclubs market is projected to reach $38 billion, with around 68,447 establishments operating nationwide, reflecting consistent growth since 2020.
While the sector has bounced back strongly due to the resurgence of on-premise socializing, it still faces competition from at-home drinking habits.
Additionally, the growing popularity of non-alcoholic beverages and health-conscious drink trends is reshaping menus and drawing in a more diverse, modern clientele.
Here’s a brief snapshot of the bar industry to give you some valuable context.
| Metric | 2025 Value/Insight |
|---|---|
| Global Market Size | $502.55 billion |
| Bars & Nightclubs Segment | $99.08 billion |
| CAGR (2024–2025) | 5.6% |
| Non-Alcoholic Beverage Market | $597 billion |
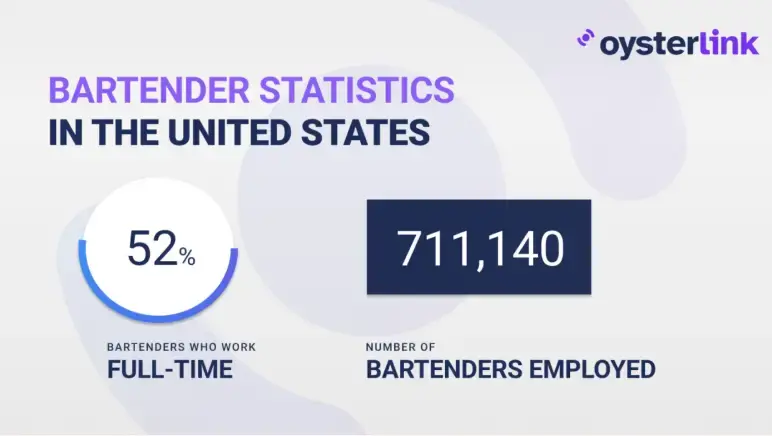
| Bartender Employment (US) | 711,140 |
| Gender Ratio (Bartenders, US) | 60.5% women / 39.5% men |
| Full-time/Part-time Ratio | 52% full-time / 48% part-time |
| Top Regions (US) | CA, TX, FL, NY, IL |
| Key Demographics | Young, urban, diverse, female-led |
| Consumer Demands | Healthier, experiential, premium |
Top Bar Industry Statistics 2025
In this section, we’ll break down the latest bar industry statistics for 2025, covering global revenue figures, market size in key regions, and emerging trends shaping the sector.
These insights will give you a clearer picture of where the industry stands and what opportunities lie ahead for bar owners and investors.
Let’s get started:
1) U. S. bar and nightclub industry statistics
In this section, we’ll cover key statistics about the U.S. bar and nightclub industry, including how many bars are in America, market size, employment figures, growth rates, and top-earning establishments. These insights will help you understand the current state and future outlook of the sector.
- From 2020 to 2025, the U.S. Bars & Nightclubs industry has expanded at a strong compound annual growth rate (CAGR) of 12.2%. (Source)
- Between 2022 and 2023, the U.S. bar and nightclub industry saw its market size rise from $36.5 billion to $37.6 billion. (Source)
- The market size of the USA is projected to reach $38.2 billion by 2028. (Source)
- There are currently 68,447 businesses operating in the Bars & Nightclubs industry in the United States, with the sector growing at a CAGR of 2.2% from 2020 to 2025. (Source)
- As of 2024, 442,527 people were employed in the Bars & Nightclubs industry in the United States. (Source)
- The US market size reached its pre-pandemic peak at $41.2 billion in 2019. (Source)
- In terms of revenue, Hakkasan Group leads the U.S. bar and nightclub scene with $360 million, followed by Groot Hospitality at $46.5 million, and The Baldwin Bar generating $5.3 million. (Source)
- The industry’s workforce is largely young, with bartenders accounting for 43% and food and beverage serving staff making up 57% of employees. (Source)
2) Bar market size and revenue statistics
Let’s take a closer look at the latest bar market size and revenue statistics, highlighting how the industry has grown over the years and where it’s headed in the future.
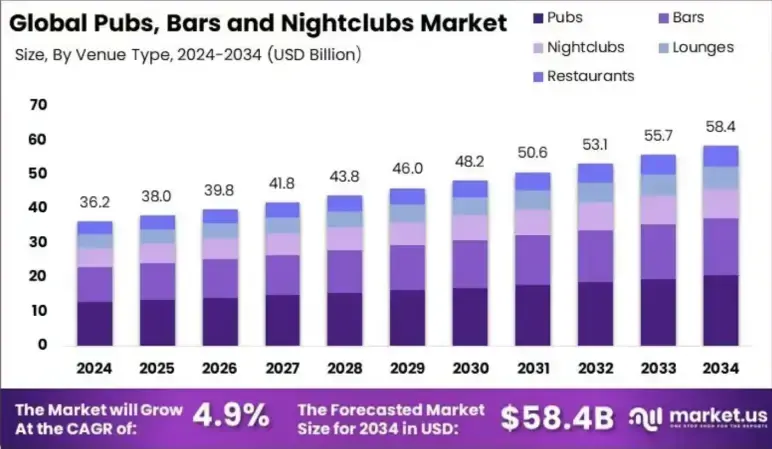
- The global pubs, bars, and nightclubs market is projected to grow from USD 36.2 billion in 2024 to approximately USD 58.4 billion by 2034, with a compound annual growth rate (CAGR) of 4.9% expected between 2025 and 2034. (Source)
- The market enjoys strong profit margins, as bars typically achieve a gross profit of 65-80%, significantly surpassing many other industries. (Source)
- In 2023, conventional energy bars held approximately 72% of the market share, driven mainly by their strong brand recognition, reliable quality, and convenience. (Source)
- The market for organic energy bars is projected to expand at a CAGR of 8.7% between 2024 and 2030. (Source)
- Nightlife entertainment remains in high demand, particularly in major cities. For example, New York’s nightlife industry generates $35 billion each year and supports around 300,000 jobs. (Source)
3) Sports bar industry statistics
In this section, we’ll break down key statistics about the U.S. sports bar industry, covering market size, business count, top-performing chains, and growth trends to give you a clear picture of this thriving sector.
- In 2025, the U.S. sports bars industry is valued at $2.2 billion, reflecting steady demand for casual dining and live sports experiences. (Source)
- In 2023, Hooters led the U.S. sports bar market with 293 locations, making it the largest sports bar chain by unit count. Dave & Buster's followed in second place with 162 locations nationwide. (Source)
- The industry has expanded at a 2.3% CAGR from 2019 to 2024, with steady, moderate growth expected to continue through 2029. (Source)
- In 2023, Hooters topped the list of U.S. sports bar chains, generating around $867 million in sales. Other notable names in the ranking included Dave & Buster's and Miller's Ale House. (Source)
- The majority of sports bar patrons are under the age of 65, making this demographic a key driver of both revenue and customer loyalty. (Source)
- The estimated cost to open a sports bar is around $218,900. This includes approximately $80,000 for renting or leasing space, $15,000 for initial inventory, and $22,970 for equipment purchases. (Source)
4) Bar industry sales statistics
In this section, we’ll highlight key sales figures and revenue trends within the bar industry, offering a snapshot of how the market has performed and where it’s headed.
- By 2025, U.S. bar industry sales are projected to hit $38.0 billion, reflecting a solid 12.2% CAGR over the five-year period from 2020. (Source)
- In 2023, the U.S. beer market climbed to $124.1 billion in revenue, surpassing pre-pandemic figures for the first time. The market is projected to reach $147.8 billion by 2029. (Source)
- In 2023, Hooters ranked as the top sports bar chain in the United States, generating around $867 million in sales. Other major players on the list included Dave & Buster's and Miller's Ale House. (Source)
- Alcohol sales in the United States had been steadily growing for years before the pandemic caused a sudden drop in 2020. By 2022, the market rebounded, with alcoholic beverage sales surpassing pre-pandemic levels, reaching $259.8 billion. (Source)
- The industry continues to benefit from steady growth, with over 68,000 bars and nightclubs operating across the U.S. in 2025, expanding at a 2.2% CAGR. (Source)
- Despite inflation driving beer prices up by 4.0% and hard liquor by 2.7%, consumer spending at bars and nightclubs has stayed strong and resilient. (Source)
- In 2023, spirits led the market with over $400 billion in at-home revenue, followed by beer at $322.2 billion and wine at $172.6 billion. By 2024, these figures climbed to $428 billion for spirits, $340 billion for beer, and $184.2 billion for wine, reflecting steady growth across all three categories. (Source)
5) Juice bar industry statistics
The juice bar industry is rapidly evolving, driven by growing consumer demand for healthier, convenient beverage options. In this section, we’ll explore key statistics that reveal market size, growth trends, and consumer preferences shaping the industry’s future.
- The U.S. juice and smoothie bar industry is expected to generate $4.0 billion in revenue by 2025, having grown at a steady 1.9% CAGR over the past five years. (Source)
- The total U.S. juice market is projected to generate $27.24 billion in revenue in 2025, with $13.92 billion coming from retail sales and $13.32 billion from restaurants, bars, and cafes through-out-of-home consumption. (Source)
- The cold-pressed juice market is on a rapid rise, valued at $1.2 billion in 2024 and forecasted to hit $2.58 billion by 2035, growing at a solid 7.2% CAGR. (Source)
- On average, individual juice bars generate $100,000 to $600,000 in yearly sales, depending on location, menu offerings, and customer demand. (Source)
- The U.S. juices market is projected to experience a slight volume decline of -0.2% in at-home consumption by 2026, reflecting shifting preferences toward fresh, functional, and on-the-go options. (Source)
- The average per capita juice consumption at home in the U.S. is expected to reach 14.92 liters in 2025, highlighting steady demand despite evolving beverage trends. (Source)
6) Bar employment & labor statistics
The U.S. bar and nightclub industry isn’t just about drinks and nightlife — it’s also a major employer. In this section, we’ll break down key employment figures, workforce demographics, job satisfaction rates, and growth trends shaping the industry’s labor market in 2025 and beyond.
- In 2025, the U.S. bars and nightclubs industry employs approximately 448,404 people, marking an average annual growth rate of 2.4% since 2020. (Source)
- Approximately 711,140 bartenders are employed across the U.S., with California, Texas, Florida, New York, and Illinois ranking as the top states for bartender employment. (Source)
- Women represent 60.5% of bartenders, while men comprise 39.5%. This gender distribution highlights the growing presence and influence of women in the bartending profession. (Source)
- The projected employment growth rate for all occupations from 2023 to 2033 is 4%, representing the average pace at which jobs across the U.S. economy are expected to expand over the decade. (Source)
- Around 52% of bartenders in the U.S. work full-time, while 48% hold part-time positions. This split reflects the industry’s flexible employment structure, catering to both career professionals and side-gig workers. (Source)
- On average, a bar or nightclub in the U.S. employs about 6.6 staff members, highlighting the industry’s lean, service-focused operations with small, efficient teams. (Source)
- Bartenders in the U.S. report an average job satisfaction rating of 3 out of 5, reflecting a balanced mix of rewarding social interaction and common industry challenges. (Source)
- In May 2024, the median annual wage for all U.S. workers stood at $49,500, meaning half of the workforce earned more than this amount, while the other half earned less. (Source)
7) Bar industry cost & profit margin statistics
This section explores key cost factors and bar revenue statistics within the bar industry, offering insights into what drives profitability and operational expenses. Understanding these metrics is essential for successful bar management and growth.
- Starting a bar in the U.S. usually requires an investment ranging from $110,000 to $850,000, with average startup costs landing near $480,000. Outfitting the space with equipment can easily surpass $30,000, while recurring expenses like rent, utilities, payroll, licenses, and inventory steadily add to operational costs. (Source)
- Bars typically enjoy an average gross profit margin of 70–80%, due to substantial markups on alcoholic beverages. (Source)
- The average net profit margin for bars typically ranges between 10–15% after covering all operating expenses, including labor, rent, utilities, and other overhead costs. (Source)
- Well-run bars keep their pour cost—the percentage of drink sales spent on alcohol inventory—between 15% and 24%, aiming for an ideal target of 20% to maximize profits. (Source)
- Wine bars typically achieve a net profit margin of about 7–10%, which is slightly lower than that of a standard bar. (Source)
- Pubs generally maintain profit margins similar to the bar industry average, with net profits ranging between 10% and 15%. (Source)
Top Bar Industry Trends to Consider in 2025
If you’re thinking about getting into the bar business or just curious about where it’s headed, let me tell you—the industry’s shifting in exciting new ways you’ll want to keep an eye on.
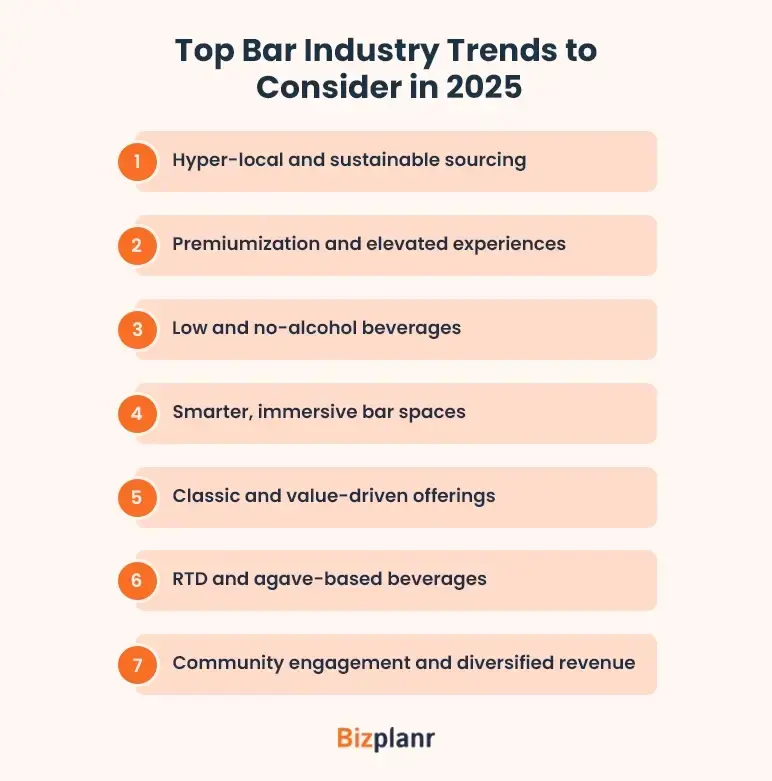
Hyper-local and sustainable sourcing
Bars aren’t just about pouring drinks anymore—it’s about telling a story with every glass. These days, the smart operators are going hyper-local. They're using ingredients from nearby farms and seasonal fruits, and collaborating with local brewers and distillers. It’s about reducing that carbon footprint, sure—but it’s also about creating authentic, regional experiences that people can feel good about.
Premiumization and elevated experiences
Now, people aren’t just coming in for a drink—they’re chasing experiences. I’m talking about cocktails crafted with precision, served with a little backstory, maybe about the history of the spirit or the bartender’s twist on a classic. Guests want to feel like they’re part of something special, and honestly, they’re willing to pay for it.
Low and no-alcohol beverages
Here’s one you probably didn’t see coming—the “sober-curious” crowd is growing fast. Non-alcoholic beers, wines, and spirits are flying off the shelves, with sales up 31% just last year. It’s not just about skipping the booze, either. These drinks are sophisticated, packed with flavor, and appeal to health-conscious younger folks, especially Gen Z.
Smarter, immersive bar spaces
Bars today are turning into experiences. You’ll find places with virtual drink menus, AR-enhanced decor, app-based drink customization — heck, some spots even have gaming nights, trivia contests, and cocktail competitions. It’s not just about what’s in the glass anymore; it’s about the vibe, the interaction, the Instagrammable moments. Keeps people hanging around longer, too, which is always good for business.
Classic and value-driven offerings
Now, while the fancy stuff is booming, there’s still love for the old-school classics. In fact, there’s a real comeback happening for simple, well-made drinks that won’t break the bank. It’s all about balancing luxury with affordability. People appreciate a good Old Fashioned done right just as much as an exotic, $18 smoked lavender gin fizz.
RTD and agave-based beverages
Ready-to-drink (RTD) cocktails are having a moment. Quick, convenient, and surprisingly good quality now. Plus, agave spirits like tequila and mezcal are on fire. They’ve gone from party shots to premium sipping spirits. New flavor combos and creative RTD options are everywhere.
Community engagement and diversified revenue
The smart bars aren’t just waiting for customers to walk in anymore—they’re getting involved with the community. Hosting events, partnering with local chefs or artists, selling bottled cocktails, and branded merch. It’s about creating loyalty and finding extra revenue beyond just pouring drinks.
Bottom line
The bar and nightlife industry isn’t just bouncing back—it’s evolving fast. From premium cocktails and alcohol-free options to immersive experiences and hyper-local sourcing, consumer preferences are reshaping the market in big ways.
With North America leading the global revenue, and regions like Europe and Latin America posting impressive growth rates, there’s never been a more exciting—or competitive—time to be in this business.
Whether you're a bar owner, investor, or enthusiast, keeping a close eye on these numbers and trends is key to staying ahead in 2025 and beyond.
We hope you enjoyed reading these informative statistics, and it will help you raise a glass to the numbers, because in this industry, stats don’t just tell the story, they shape the future.
Get Your Business Plan Ready In Minutes
Answer a few questions, and AI will generate a detailed business plan.
Frequently Asked Questions
How many bars are in the U.S.?
There are 68,447 bars and nightclubs in the U.S. in 2025, growing at a 2.2% CAGR since 2020.
What is the current size of the bar industry?
The U.S. bar and nightclub industry is worth $38.0 billion in 2025, after 12.2% CAGR growth over five years.
What are the biggest trends in the bar industry?
Major trends include health-conscious drinking, the rise of alcohol-free and low-alcohol options, craft and premium cocktails, and technology integration.
How has the bar industry recovered post-COVID?
The U.S. bar industry has shown clear signs of post-COVID recovery, with revenue for bars, nightclubs, and taverns reaching $36.9 billion in 2025-a 2.5% increase over the previous year.
Are alcohol-free bars gaining popularity?
Yes, alcohol-free bars are rapidly growing in popularity, driven by health-conscious consumers and younger generations seeking sober socializing.
What’s the average profit margin for bars in the U.S.?
Average profit margins for leading U.S. bar companies are around 2.4% in 2025. While gross profit margins on drinks can reach 65–80%, overhead expenses like rent, staffing, and licensing pull down net margins, making efficient management crucial for profitability.
Which state has the most bars?
States with the most bars include California, Texas, Florida, New York, and Illinois. These states benefit from large urban populations, strong tourism industries, and culturally active nightlife economies, making them prime hubs for both established chains and trendy local establishments.
What demographic visits bars the most in 2025?
In 2025, younger adults, particularly Gen Z and millennials, dominate bar traffic across the U.S. Millennials continue to value social drinking and craft cocktails, while Gen Z reshapes nightlife trends with a growing preference for low-ABV and alcohol-free options.
What is the average bar sales per night?
The average bar sales per night can vary widely depending on location, size, and type of bar, but here are some key figures from 2025 data: Monthly, the average bar revenue in the U.S. is about $29,200, which breaks down to roughly $970 per day, assuming 30 days of operation.


Follow Bizplanr Team